
Class Results
On this page
Class Results is the report you’ll use most. It shows how each student did on a test, who needs help, and what to do next.
To open it, go to a test and click Class Results.
At a glance
The top of the report shows the Class Average, Students Assessed, Score Range and Needs Attention, the number of students below your proficiency cut score.
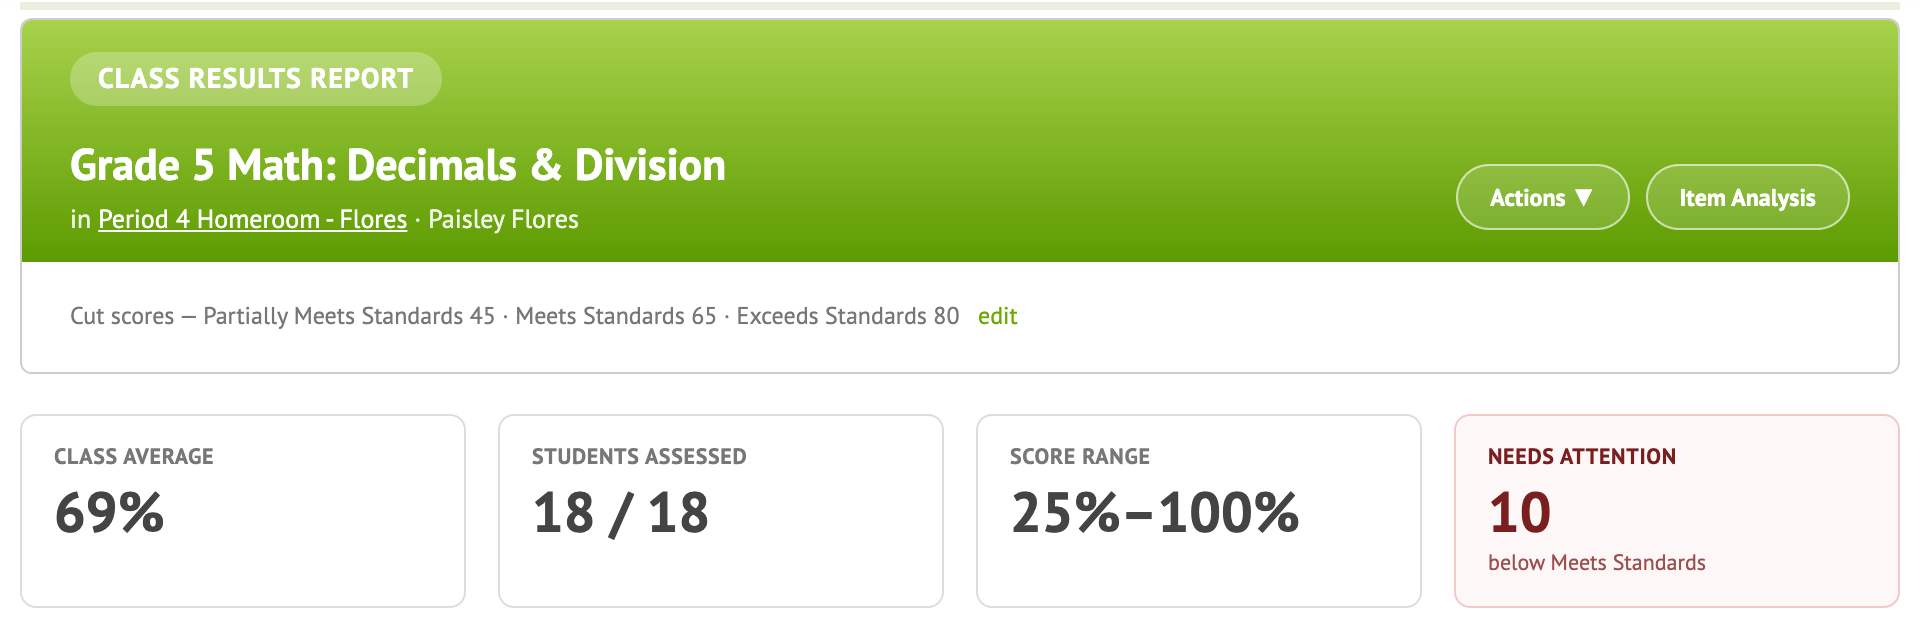
Your cut scores appear in the header. Click edit to change them. In the examples below, “Meets Standards” is the label for this teacher’s proficiency level, so yours may read differently.
Start with Insights
Naiku reads your class’s results and writes plain-language Insights. Each one names the students or standards involved and suggests a next step.
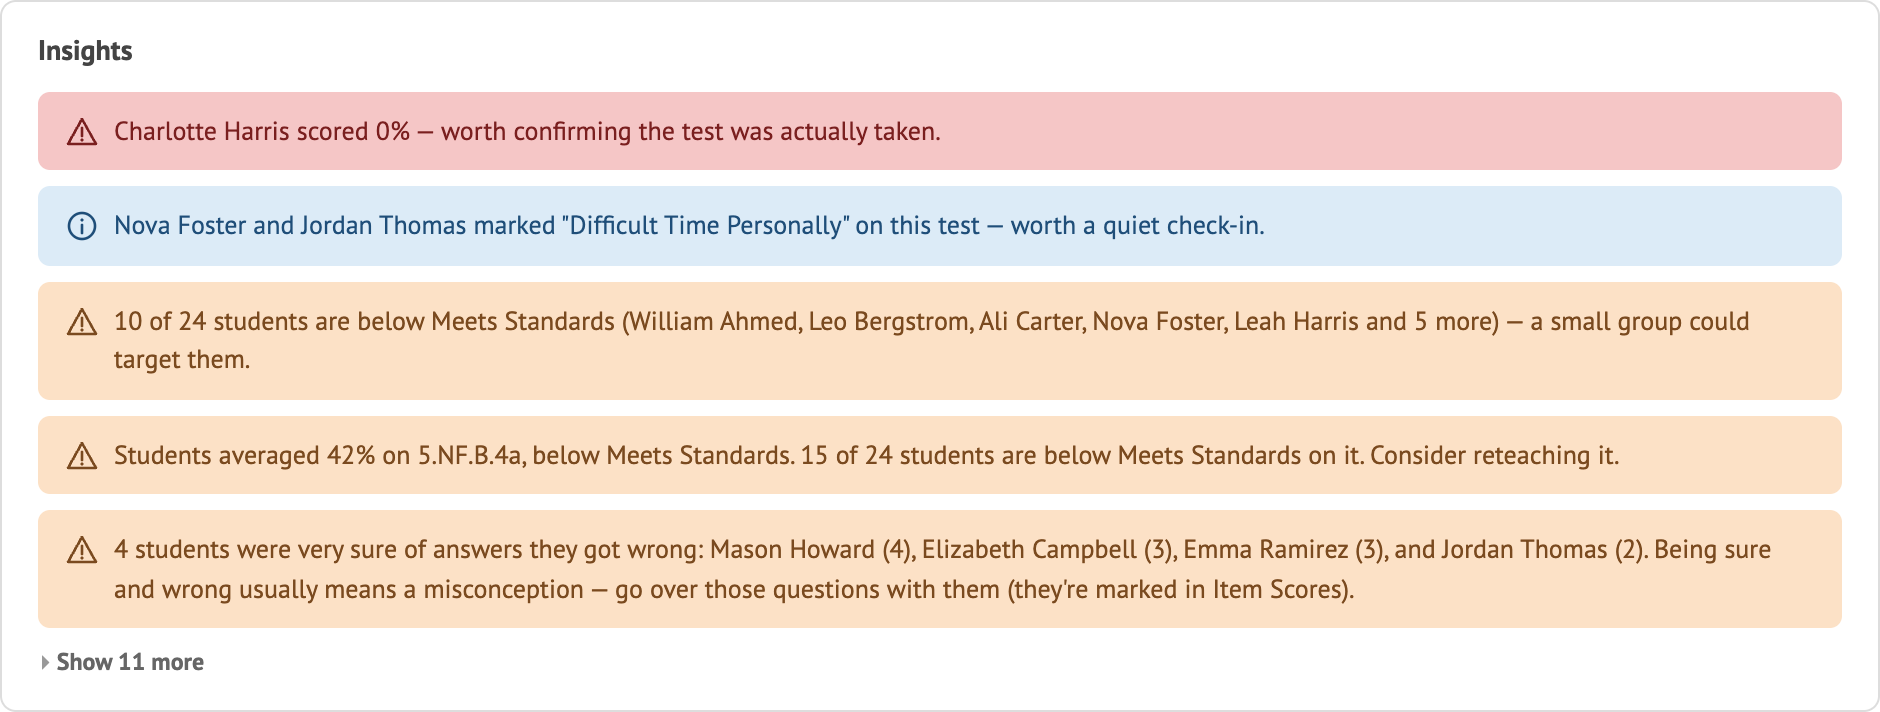
The most important insights come first. If there are more than five, click Show more to see the rest.
| Color | What it means |
|---|---|
| Red | Check this first. The data or the test itself may have a problem. |
| Orange | Needs your attention. Something to reteach or follow up on. |
| Blue | Good to know. Context that can help you plan. |
| Green | Going well. Something to celebrate or build on. |
Insights are fixed rules applied to your students’ results, so every number in them matches the report. The examples below use a sample class of 24 students.
Check on these first

- A score of 0%. Confirm the student actually took the test before you trust it.
- Difficult Time Personally. A student said this in their reflection. Naiku lists every one by name so you can quietly check in.
Who needs help, and how to group them
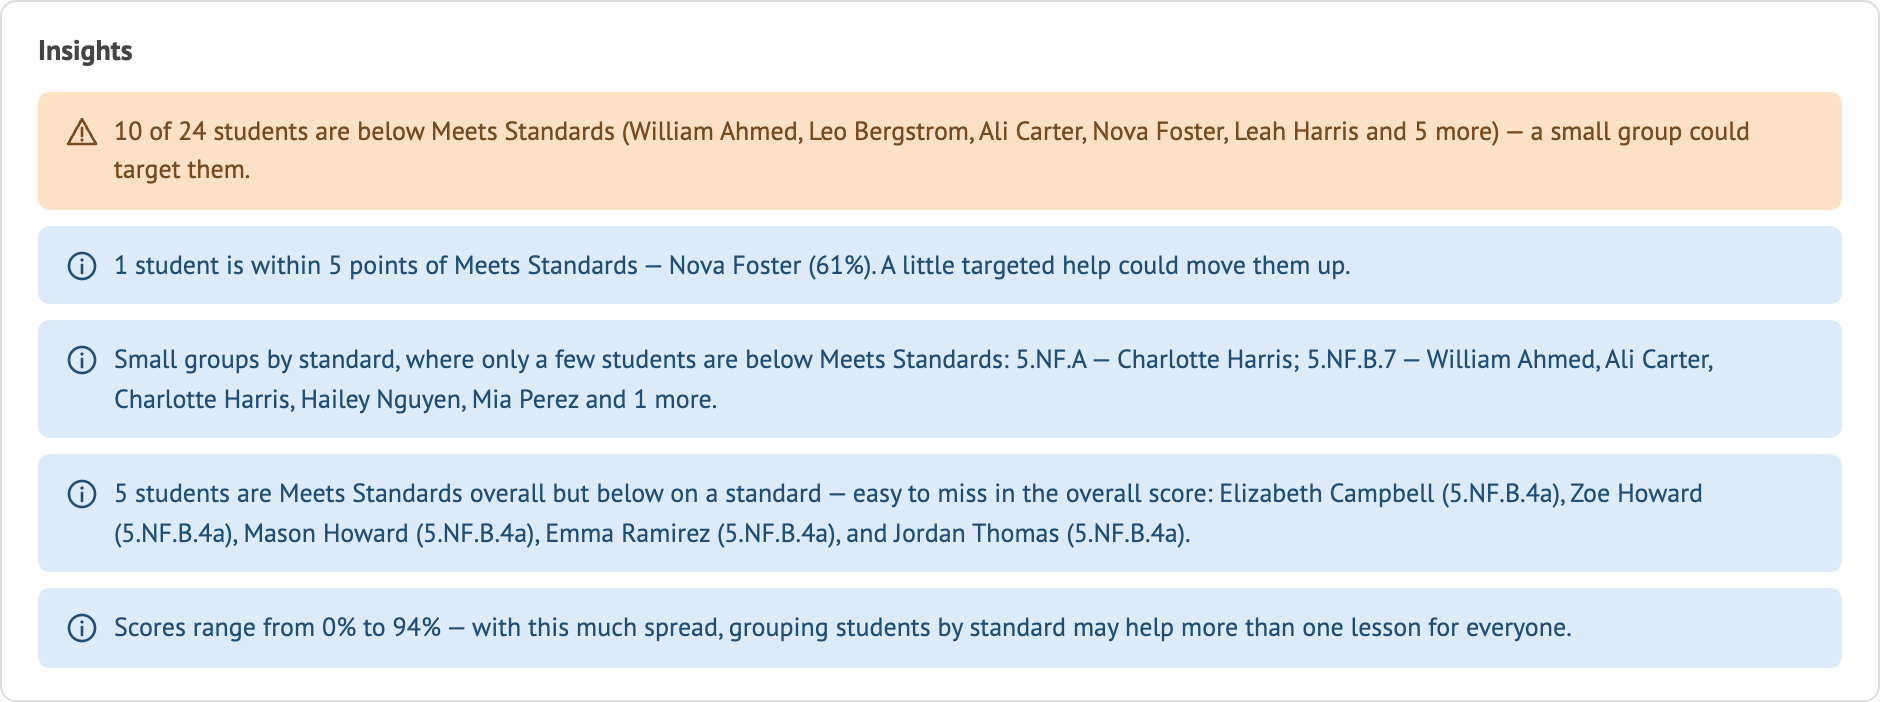
- Below proficiency. If half or more of the class is below, reteach everyone. If only a few are, work with a small group.
- Almost there. Students within 5 points of proficient. A little targeted help could move them up.
- Small groups by standard. Standards where only a few students are below, with their names, ready for a small group.
- Hidden gaps. Students who are proficient overall but below on a standard. These are easy to miss when you only look at the total score.
- Wide spread. Scores differ by 60 points or more, so grouping by standard may work better than one lesson for everyone.
Standards to reteach or build on

Naiku names the standards the class is below on, starting with the lowest, and the ones where the class reached your top level.
Growth since the last test
Naiku compares each student with the class’s previous test.

- Dropped 20 or more points. Worth a check-in.
- Improved 20 or more points. Worth celebrating.
- Class average moved. The class is up or down 5 or more points, among students who took both tests.
How students approached the test
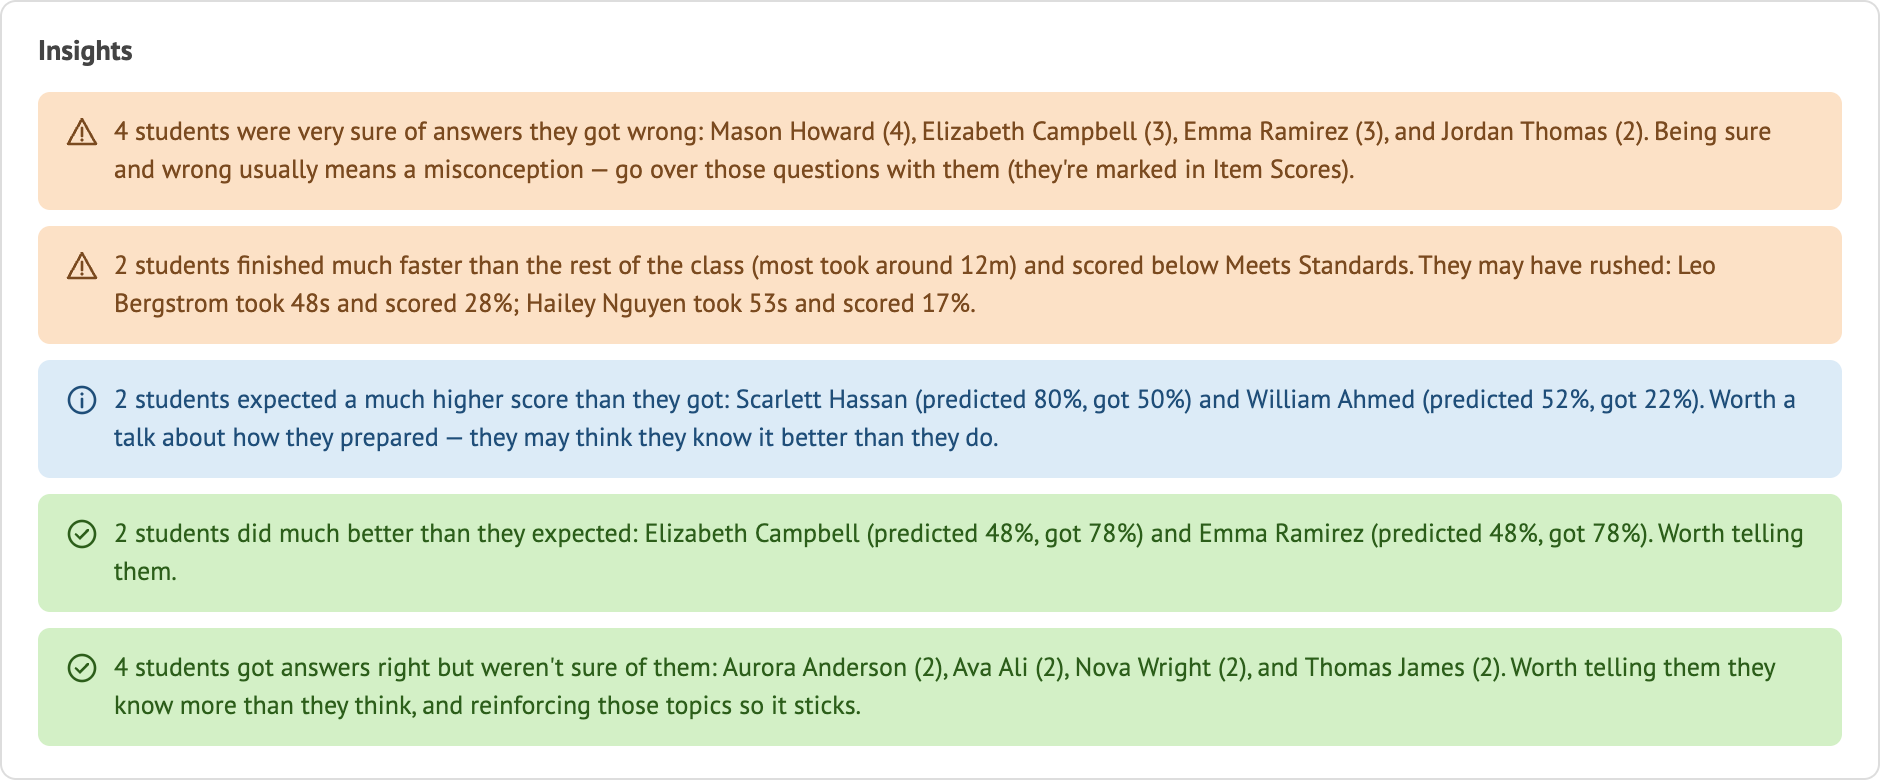
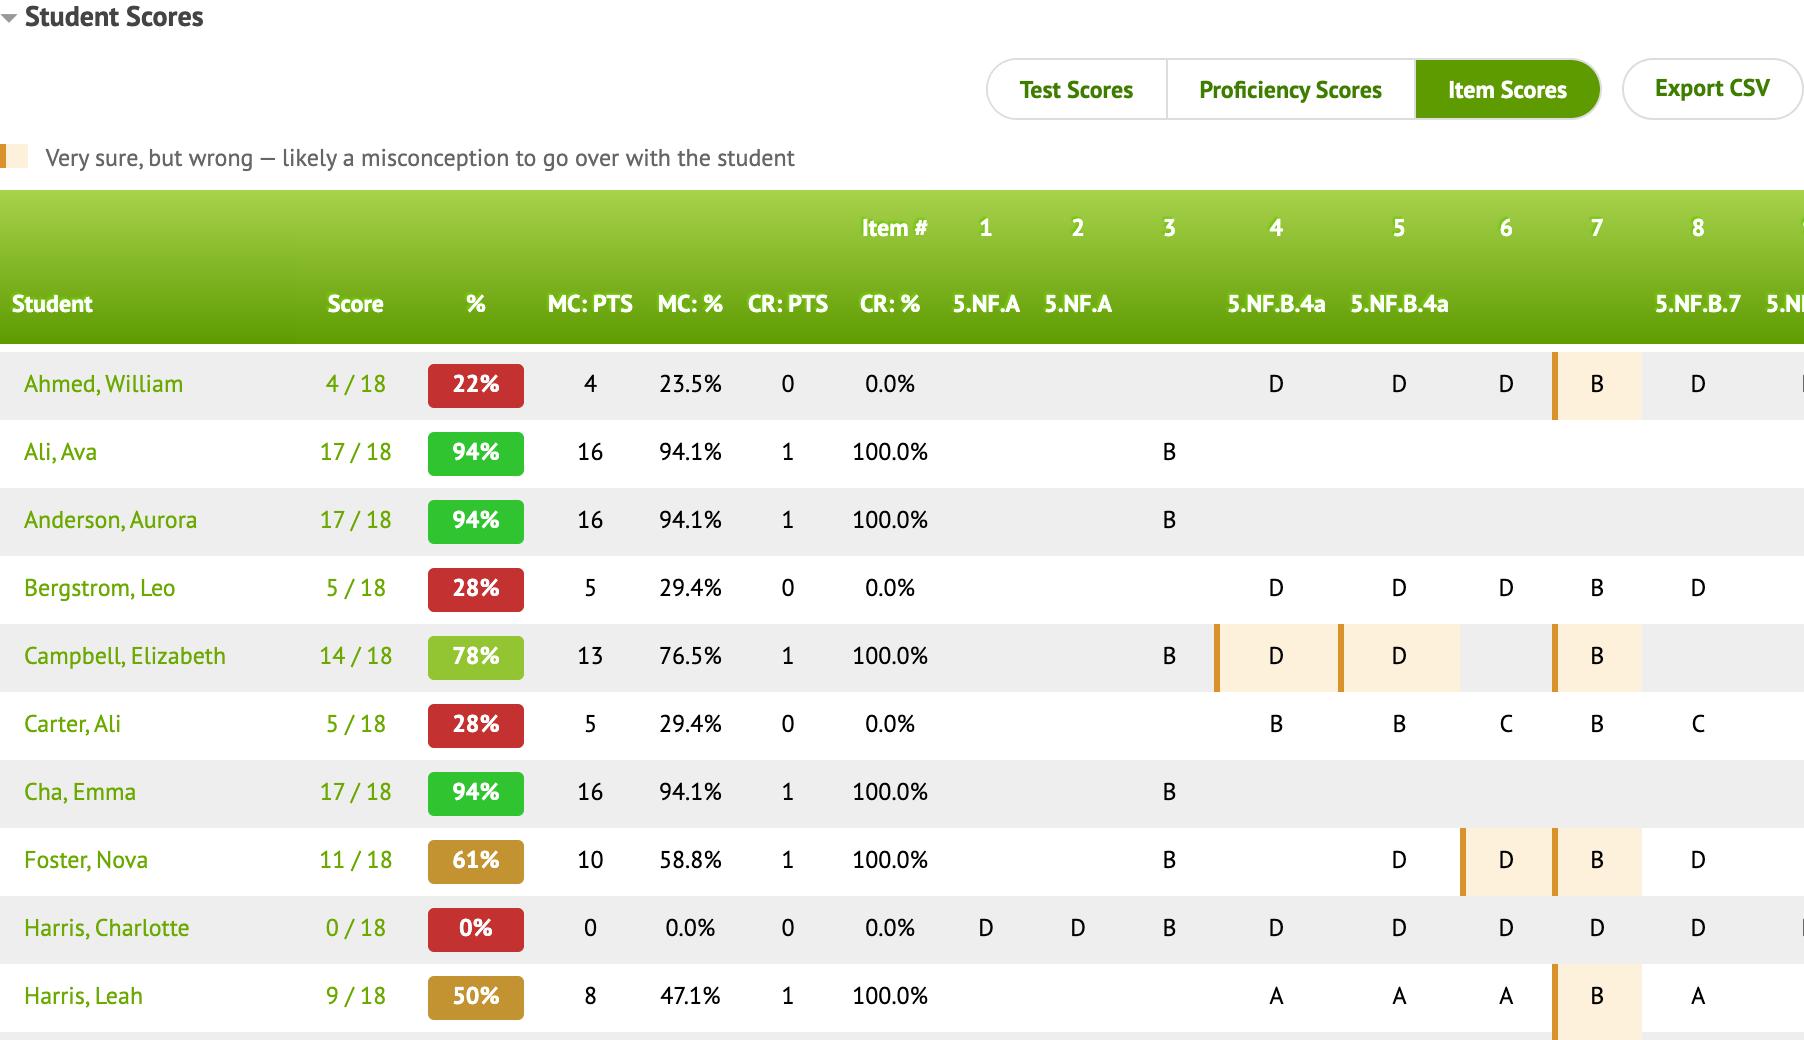
- Very sure but wrong. Likely a misconception. Those answers are marked in Item Scores.
- May have rushed. Students finished in under a third of the class’s typical time and scored below proficient.
- Expected more. Students predicted 20 or more points above their score. Talk about how they prepared.
- Did better than expected. Students scored 20 or more points above their prediction. Tell them.
- Right but unsure. They know more than they think, so reinforce those topics.
Proficiency and who needs attention
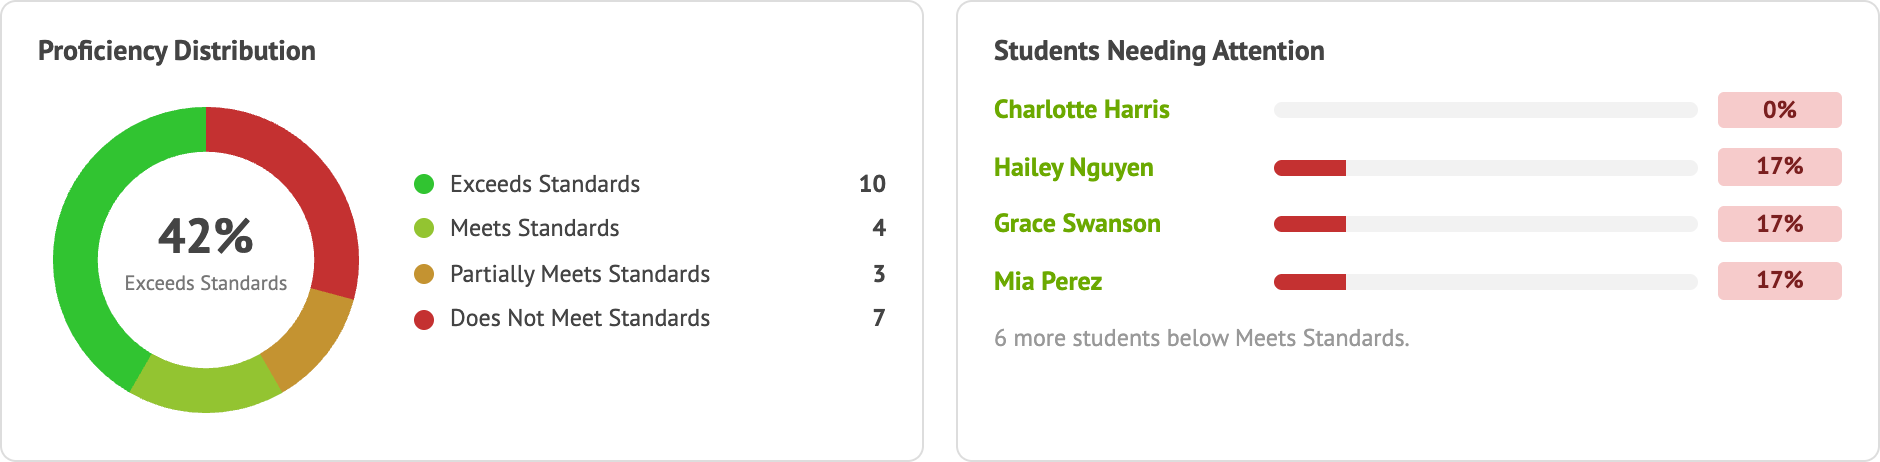
- Proficiency Distribution shows how many students are at each level.
- Students Needing Attention lists students below the cut score, lowest first. Click a name to open their results.
- Students Who Missed the Test lists students who were assigned the test but have no result.
Student Scores
This table has one row per student and three views. Export CSV downloads the view you’re looking at.
Test Scores shows each student’s score, percent and result on each standard.
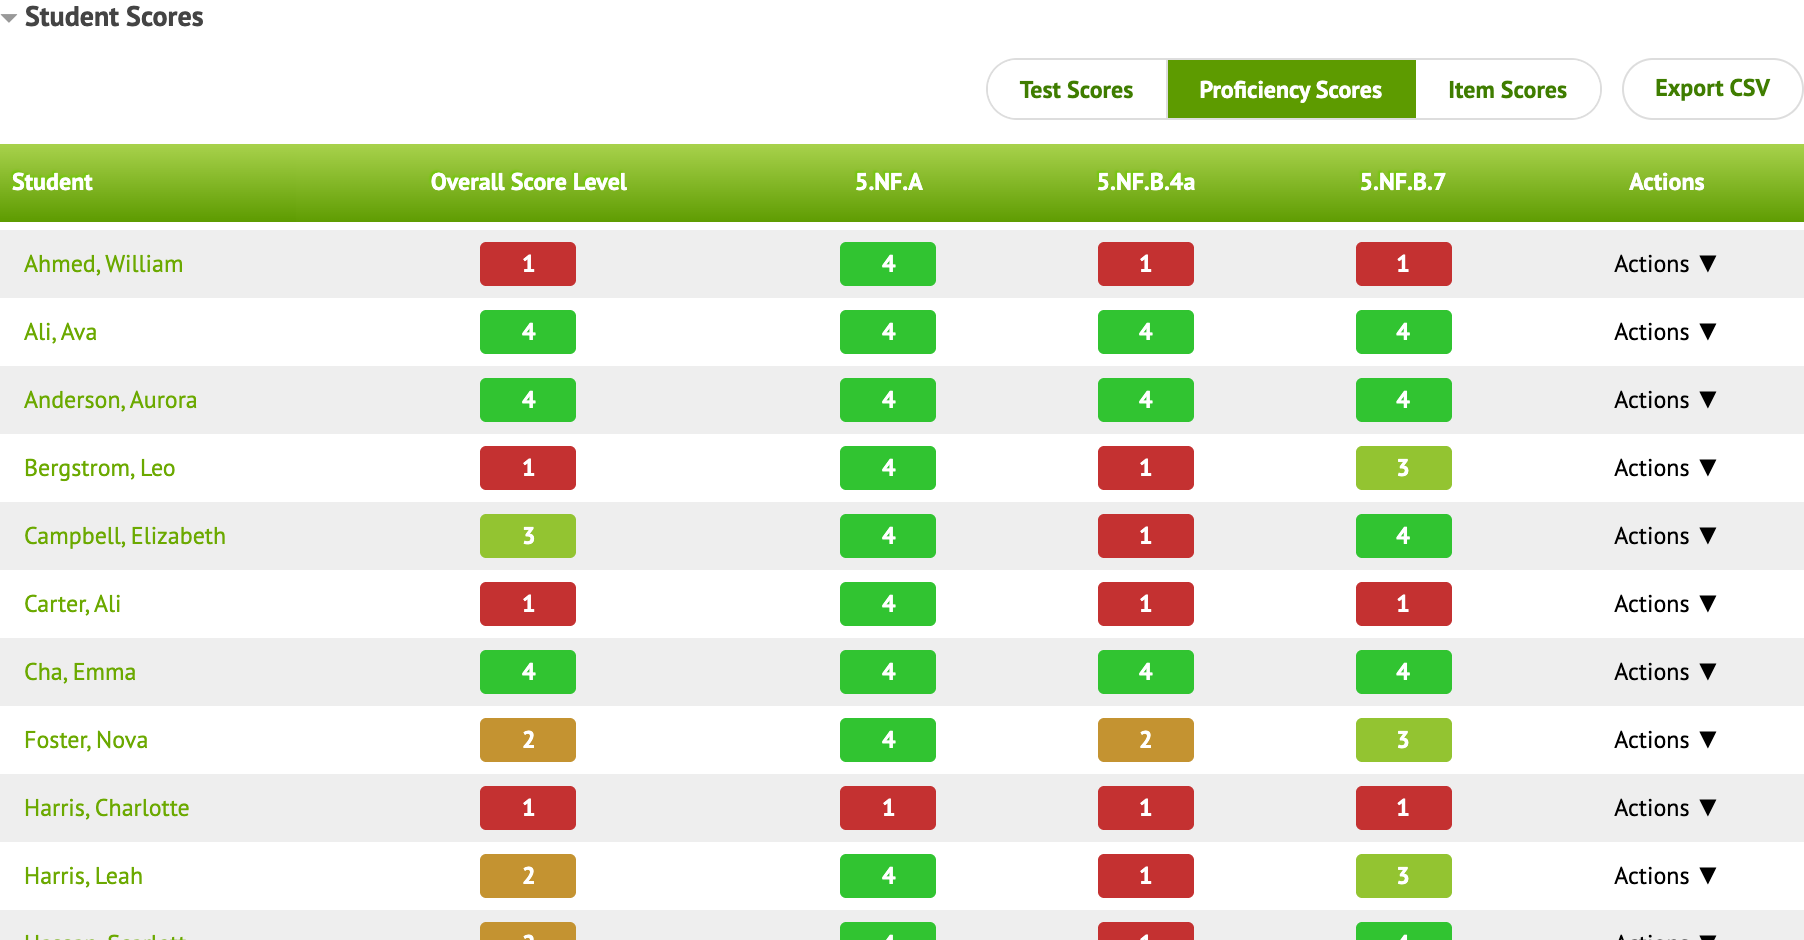
Proficiency Scores shows each student’s level on each standard.
Item Scores shows every student’s result on every question. A blank cell means correct, a letter is the wrong choice the student picked, and a number is points earned on a constructed response. Orange cells mark answers the student was very sure of but got wrong.
Click a student’s name to see their test, answers and reflection.
By Standard
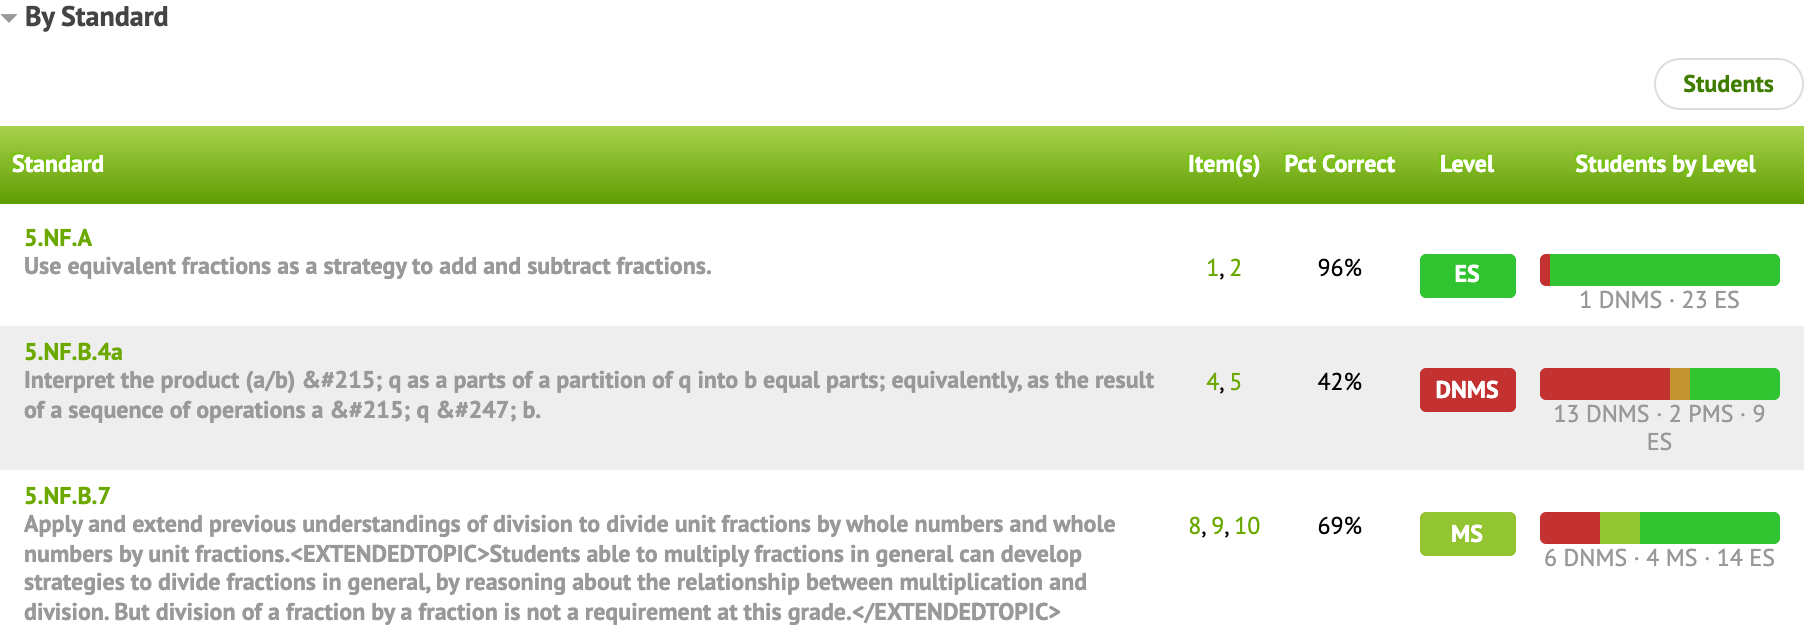
See how the class did on each standard, with a bar showing how many students landed at each proficiency level. Hover over a bar for the exact count, or click Students to see the names at each level.
More on the report
- Advanced Statistics: mean, standard deviation, score range, reliability (KR-20) and SEM.
- Learning Resources: the resources students were sent, if the test uses them.
- Previous Results: earlier attempts on a test with retakes, and deleted results. These don’t count in the report.
- Also in ▼: jump to this test’s results in your other classes.
From the Actions menu
Re-score (to change points by hand), Re-open, Restrict student access / Allow student access, Print, and Export to Gradebook. If an answer key was wrong, see Fix a Wrong Answer Key.