
Reports for Principals and District Leaders
On this page
- Start with the Principal Dashboard
- Key numbers
- Who could use support
- Compare teachers or schools
- See school-wide patterns with the Standards Heatmap
- Create a report
- Common Assessment Report
- Key numbers and the top insight
- Who needs attention
- By Class
- By Item
- By Demographics
- Standards Performance by Student
- Comparing with an outside test
- Look at one class
- A simple monthly routine
Principals and district administrators can see results across teachers, classes and schools. Use these reports to decide where to focus and which teachers or students could use support.
Start with the Principal Dashboard
Your Principal Dashboard is the page you see when you sign in. Use the menus at the top to choose the School Year, the date range, and grades, subjects or assessments. If you oversee more than one school, choose a school or All My Schools to compare schools instead of teachers.
Key numbers

- % Meets Standards or Above (or your school’s proficiency label): the share of student results at or above the proficiency cut score.
- Tests Taken and Assessments Created: how much Naiku is being used.
- Teachers Inactive: teachers with no test results in the last 14 days. They may need a hand getting started or a reminder.
Who could use support
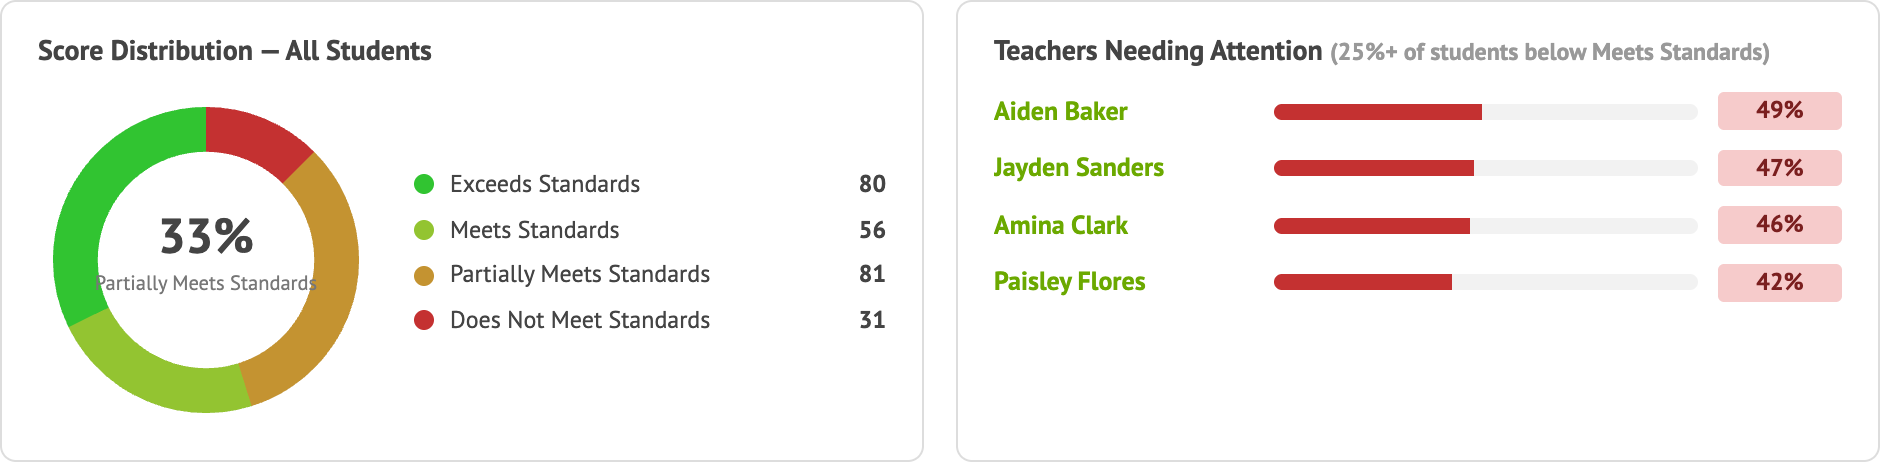
- Score Distribution shows how all student results split across your proficiency levels.
- Teachers Needing Attention lists teachers with 25% or more of their students’ results below proficient, highest first. Click a name to see that teacher’s work.
Compare teachers or schools

The ranked list shows each teacher’s average student score against the cut score. Faded bars mean fewer than 10 results, so read those with caution. Treat this as a starting point for a conversation, since classes differ.
See school-wide patterns with the Standards Heatmap
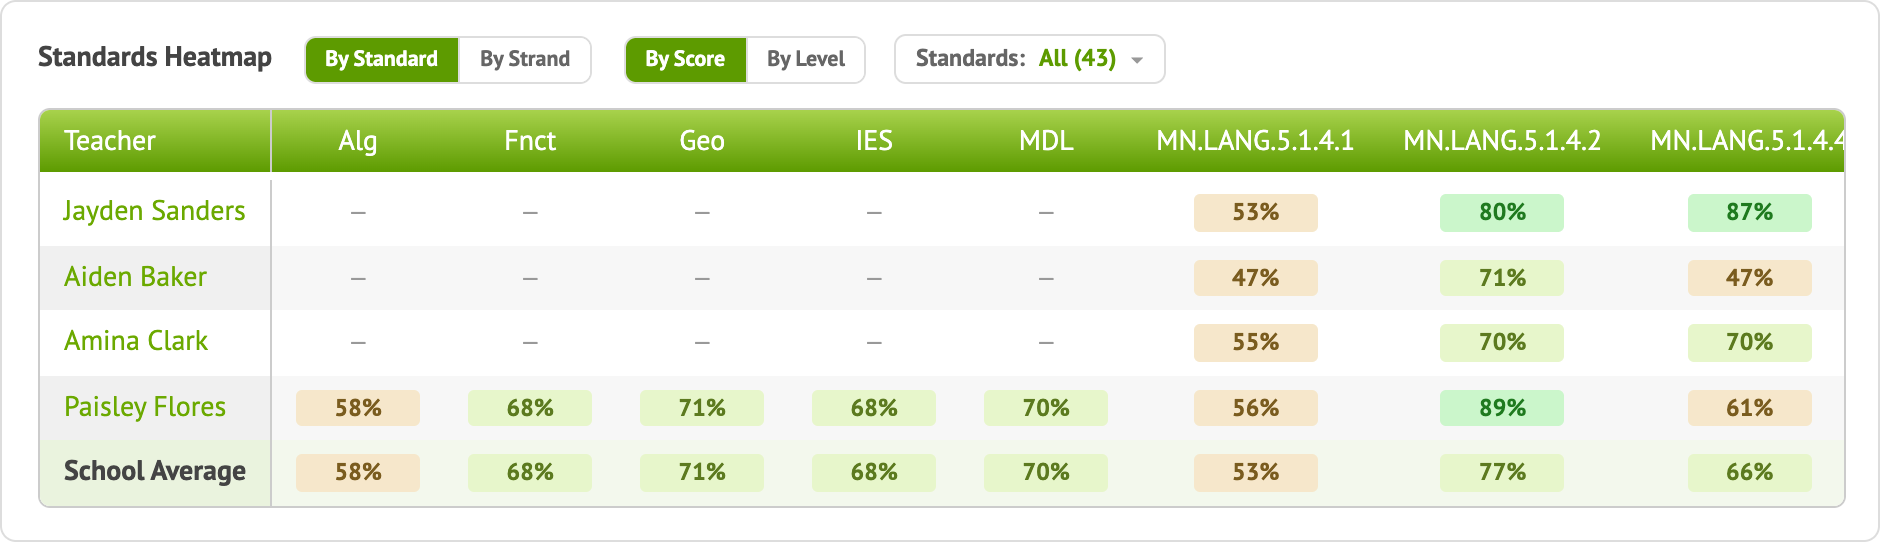
Each row is a teacher and each column is a standard. Look for:
- A low column across teachers: a school-wide curriculum or pacing issue.
- One low cell where others are strong: a chance for colleagues to share what’s working.
- Blank cells: that teacher hasn’t assessed that standard in this period.
Switch between By Standard and By Strand, and between By Score and By Level.
Create a report
- Click Reports, then Create a New Report.
- Pick the report type.
- Search for the assessment, students or standards (each report explains what to pick), and click Generate Report.
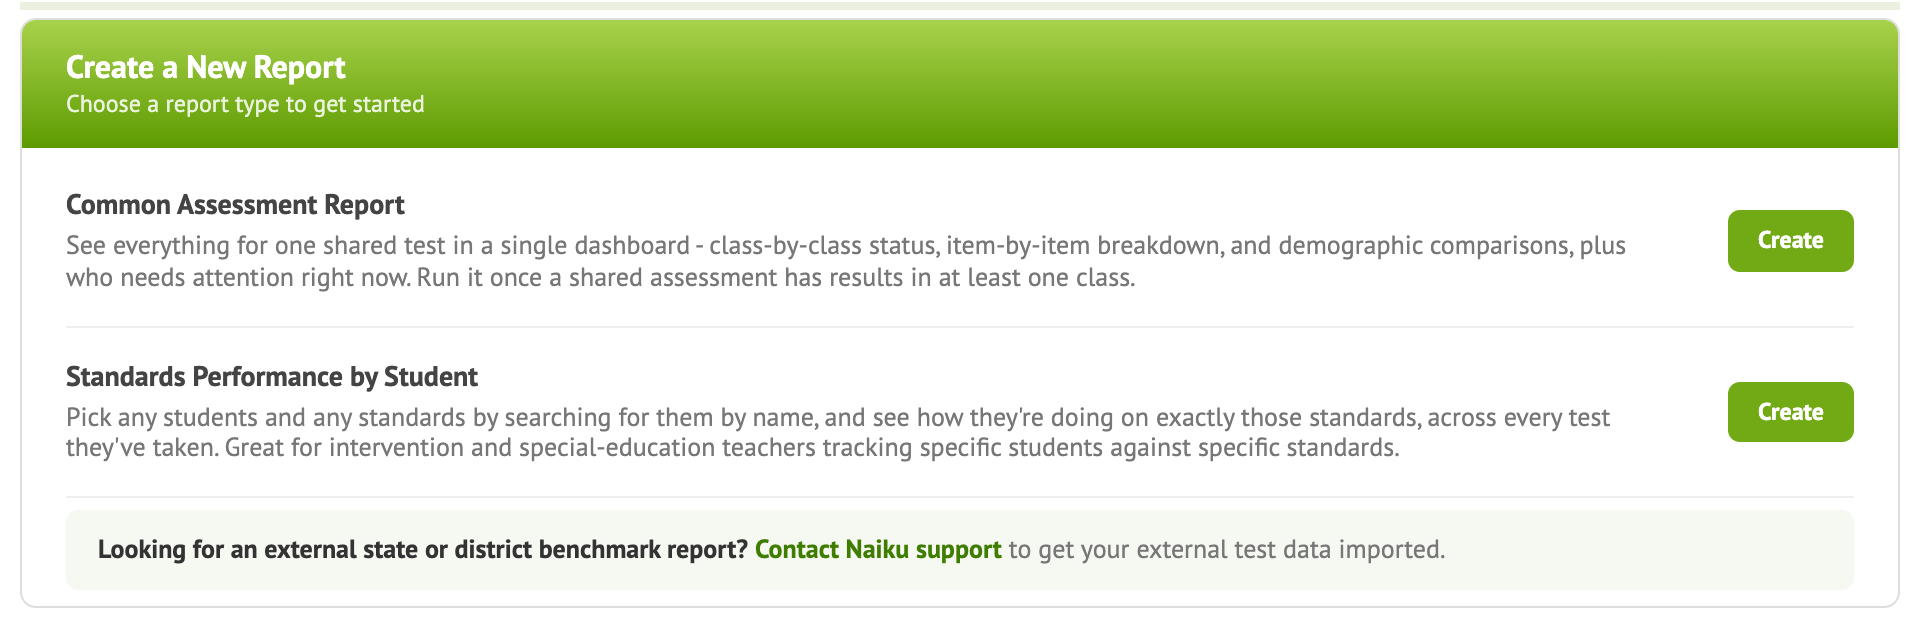
Generated reports are saved under your stored reports for 30 days, so you can come back to them or share them. Most can be printed as a PDF.
Common Assessment Report
This is the main report for one test given across many classes. Search for the test by name and click Generate Report.
Key numbers and the top insight
The report opens with the average, how many students took the test and how many haven’t, the number of classes, and who needs attention. Below that, Naiku shows the single most important thing to look at.

| Insight | When you’ll see it |
|---|---|
| A score of 0% | A student scored 0%. Confirm the test was actually taken. |
| Below proficiency | Half or more of students are below the lowest cut score. |
| Weakest standard | One standard is 65 or more points below the strongest. |
| Students well below average | Five or more students are 15+ points below the average. |
| Already advanced | 90% or more of students are at the top level. |
Who needs attention
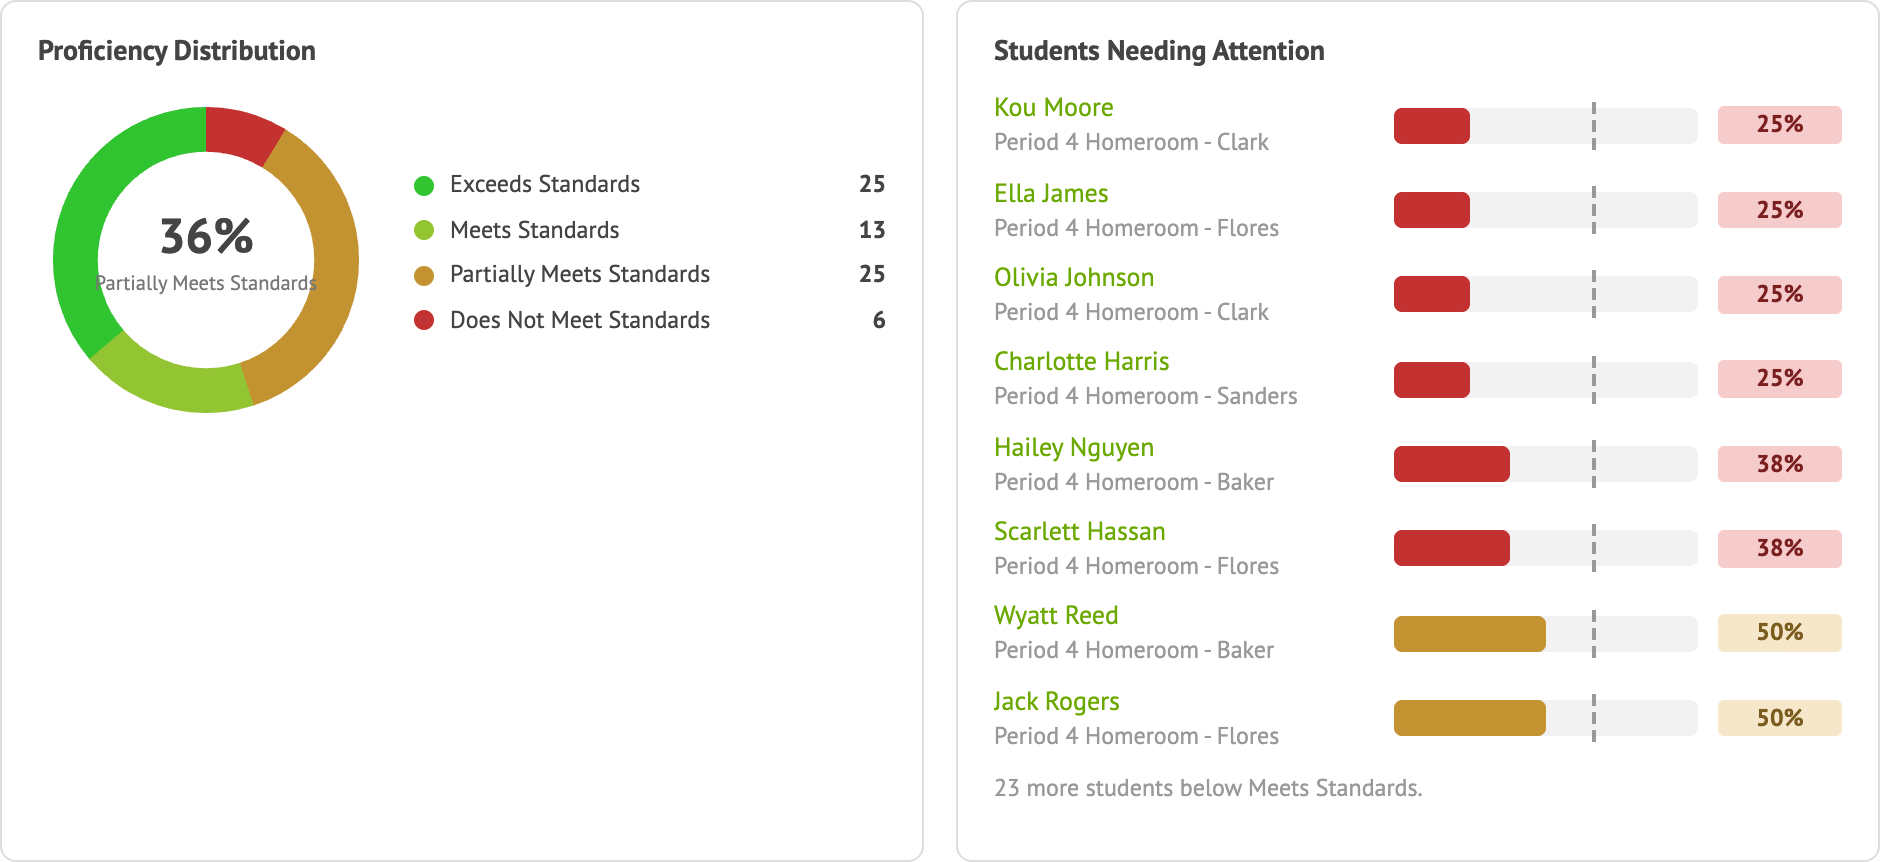
Students Needing Attention lists students below proficient across every class that took the test, with their class. Click a name for their full results.
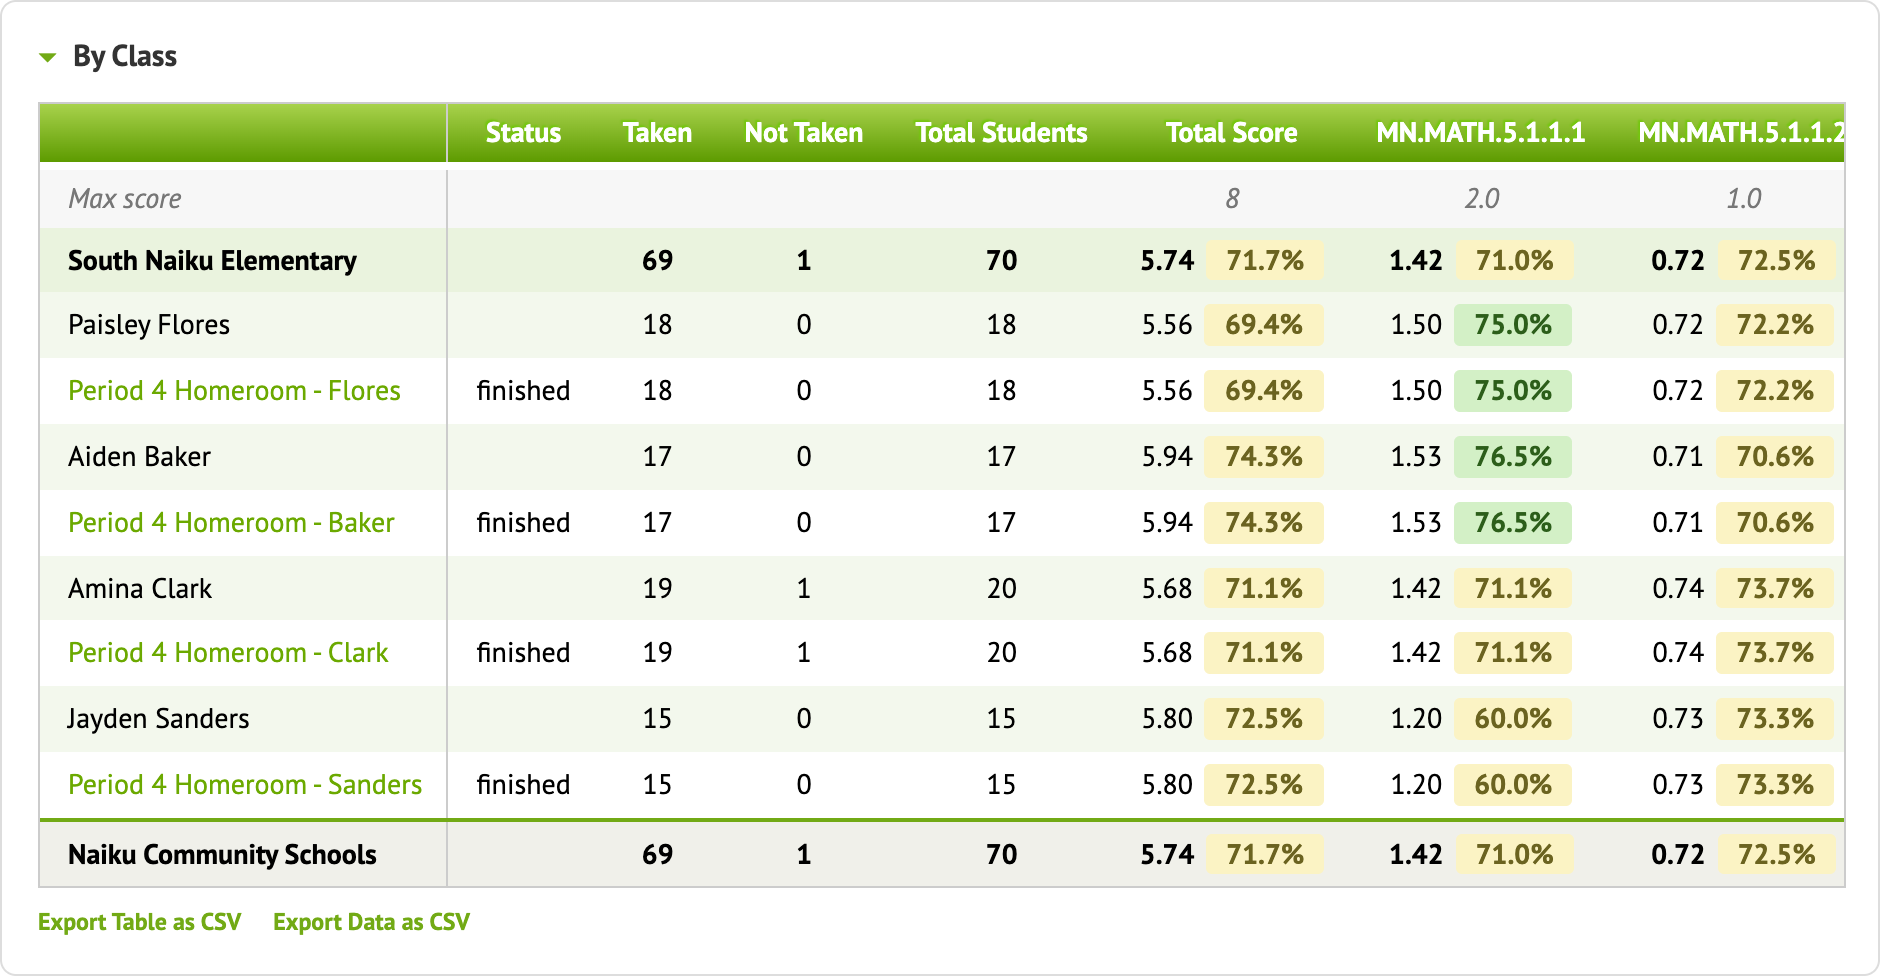
By Class
Each class’s average and proficiency breakdown by standard, compared across teachers and schools.
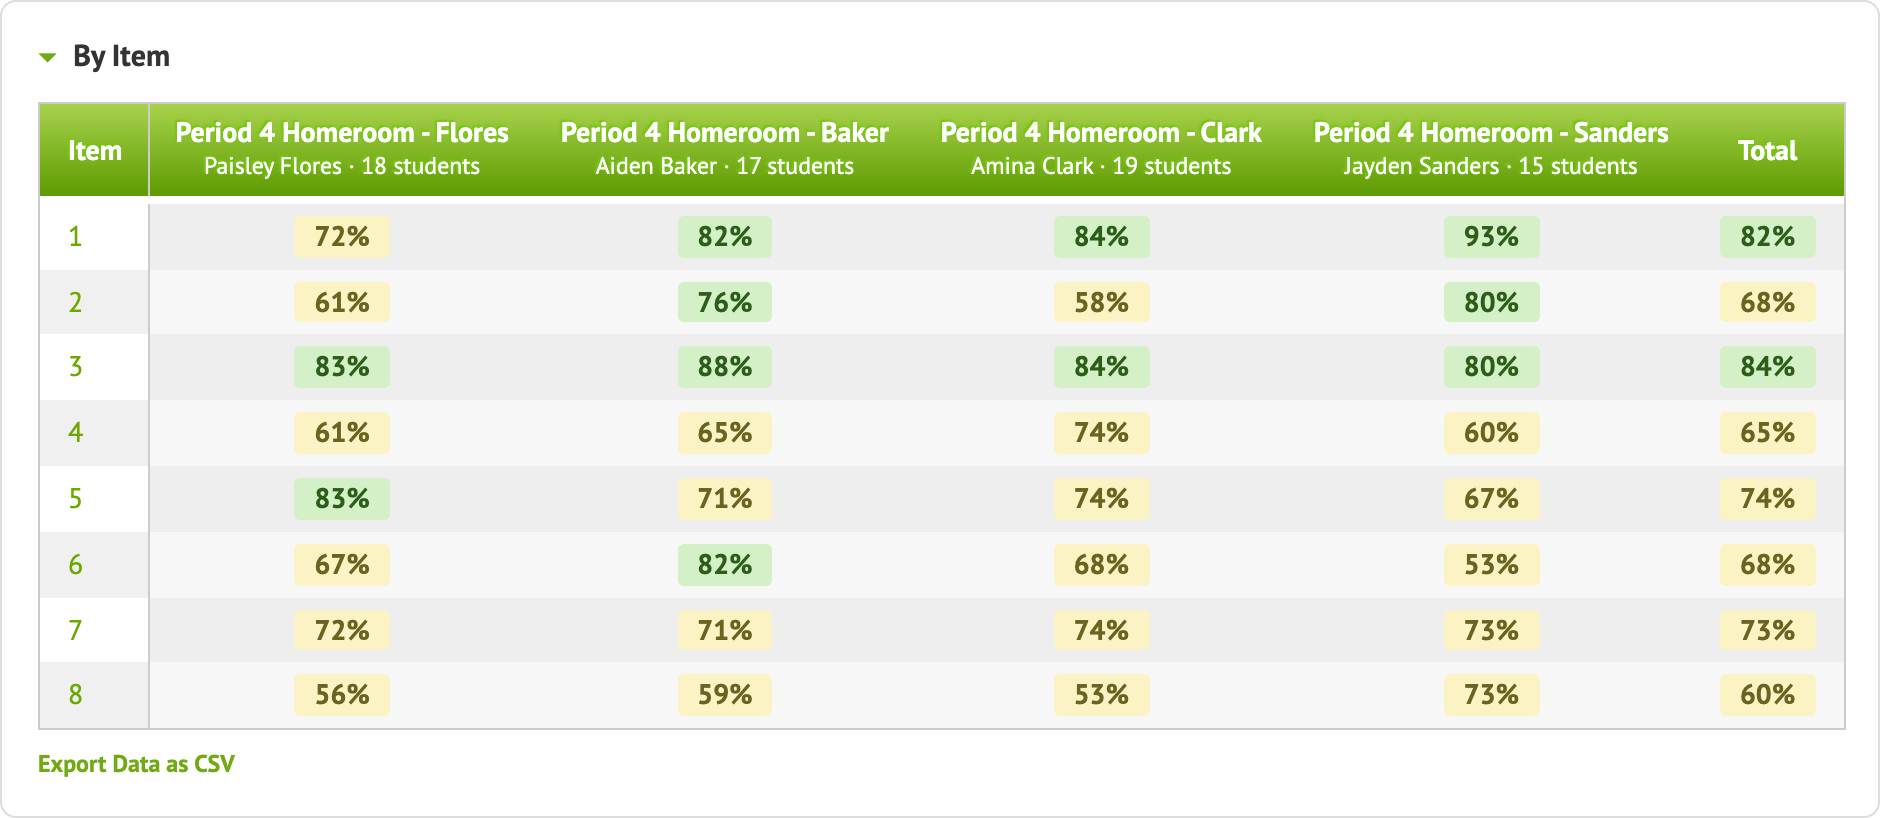
By Item
How each class did on each question. Look for a question where one class is well above the others, then ask what that teacher did differently. Click a column header to sort.
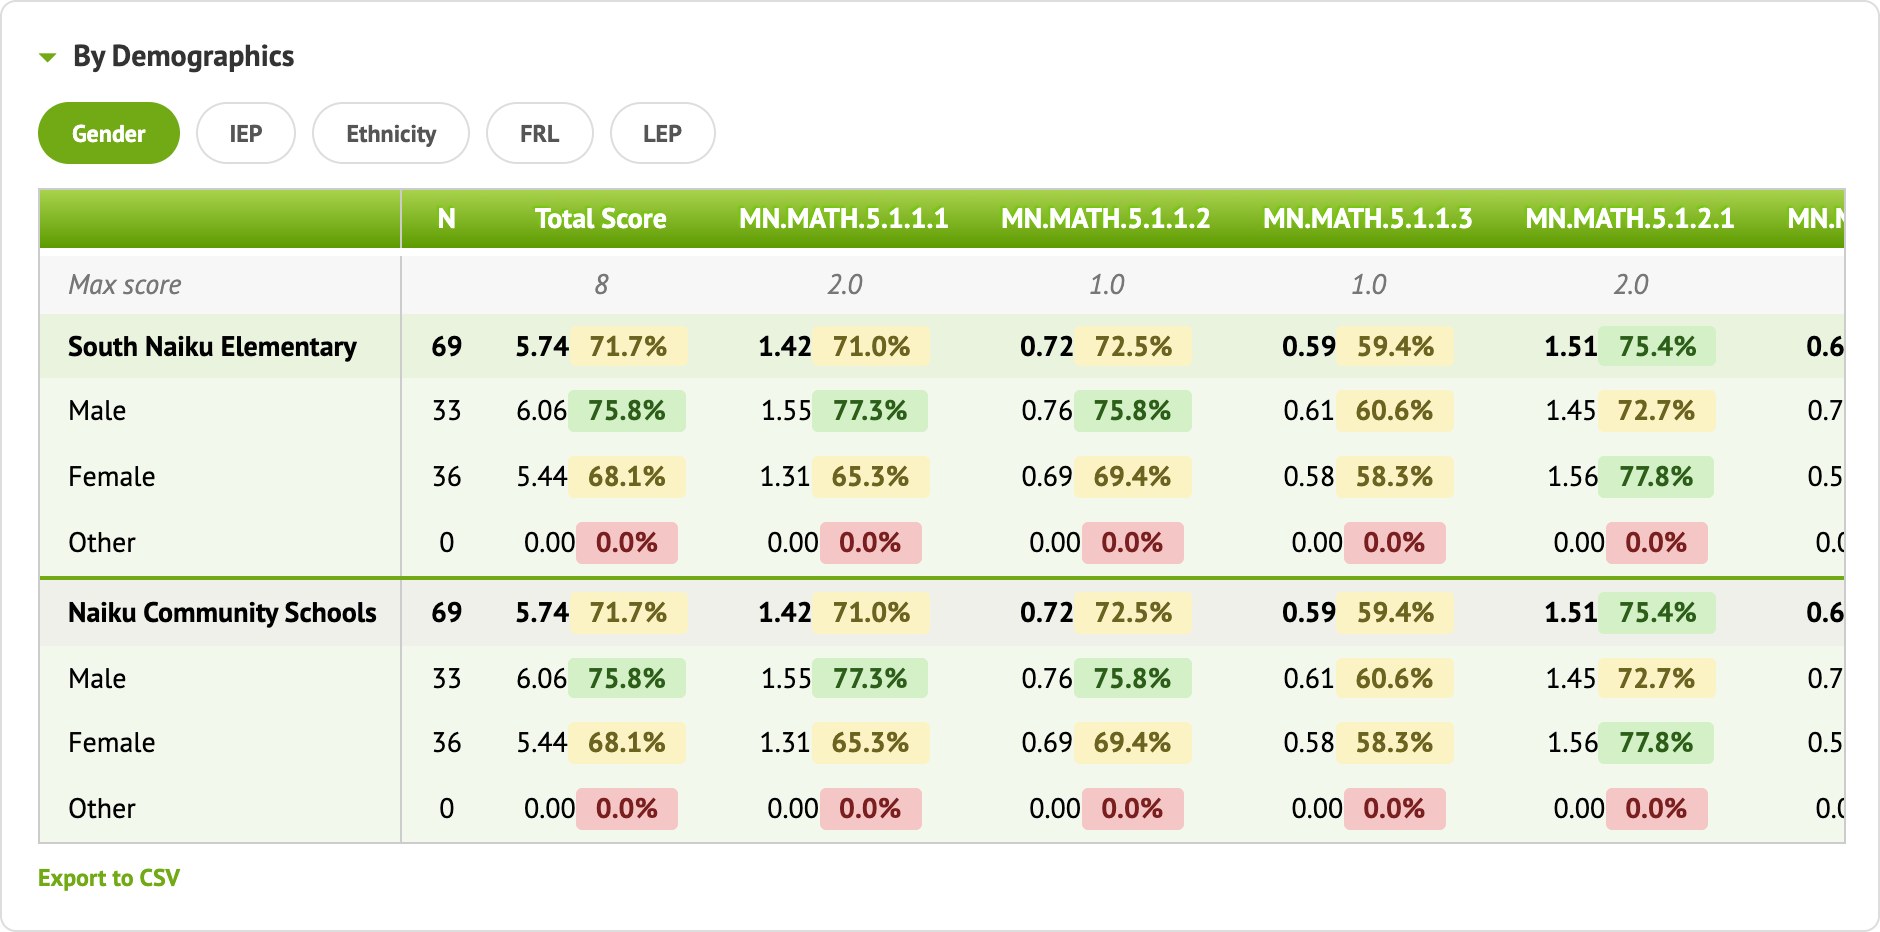
By Demographics
Results by student group, for equity conversations. Switch between Gender, IEP, Ethnicity, FRL and LEP.
Standards Performance by Student
Pick students and standards. The report shows how those students are doing on those standards across every test they’ve taken, with a top insight, the students needing attention, and a heatmap. It’s built for intervention and special education teachers tracking individual progress.
Comparing with an outside test
Naiku can also compare your results with an outside test, such as a state test. Contact support@naiku.net to set up the outside data.
Look at one class
From your dashboard, you can open any teacher’s classes, including the same reports they see:
- Class Dashboard: a class over time, with a Last Year view of how its students did.
- Class Results: one test, with insights about each student.
- Item Analysis: one test, question by question.
A simple monthly routine
- Check usage. Look at Tests Taken and Teachers Inactive, and reach out to anyone who needs help.
- Find the pattern. Use the Standards Heatmap to pick one or two standards to focus on.
- Bring it to your PLCs. Run a Common Assessment Report and look at By Item together.
- Follow up. Check the same standards next month.