
Item Analysis
On this page
Class Results tells you how each student did. Item Analysis tells you how each question did. Use it to find what to reteach, spot a misconception, and catch a bad question before it counts against students.
To open it, go to a test and click Item Analysis.
Start with Insights
Naiku reads the results for you and writes plain-language Insights at the top of the report. Each one says what stands out and what to do about it. Click an item number, like #7, to jump to that question.
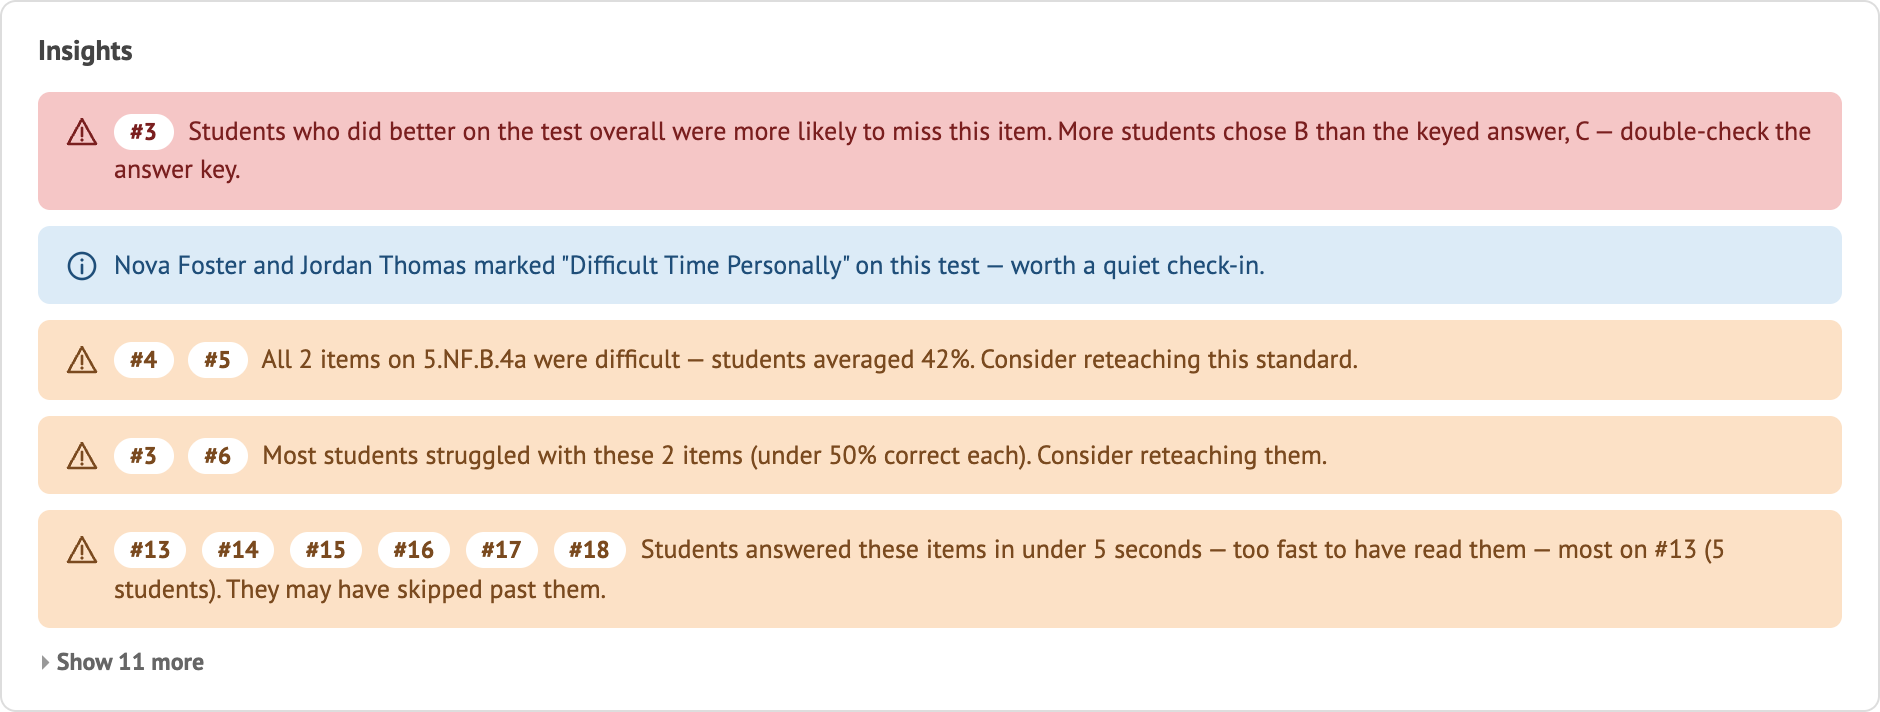
The most important insights come first. If there are more than five, click Show more to see the rest.
| Color | What it means |
|---|---|
| Red | Check this first. The data or the test itself may have a problem. |
| Orange | Needs your attention. Something to reteach or follow up on. |
| Blue | Good to know. Context that can help you plan. |
| Green | Going well. Something to celebrate or build on. |
Insights are fixed rules applied to your students’ results, so every number in them matches the report. The examples below use a sample class of 24 students.
Check the question first
If a question is flawed, its results aren’t telling you about your students. Fix these before you reteach anything.

- Possible bad question. Students who did well overall were more likely to miss it. That often means a wrong answer key or confusing wording. If more students chose another answer than the keyed one, Naiku tells you to double-check the key.
- Difficult Time Personally. A student used this reflection to say they’re having a hard time. Naiku lists every student by name, so you can quietly check in.
What to reteach
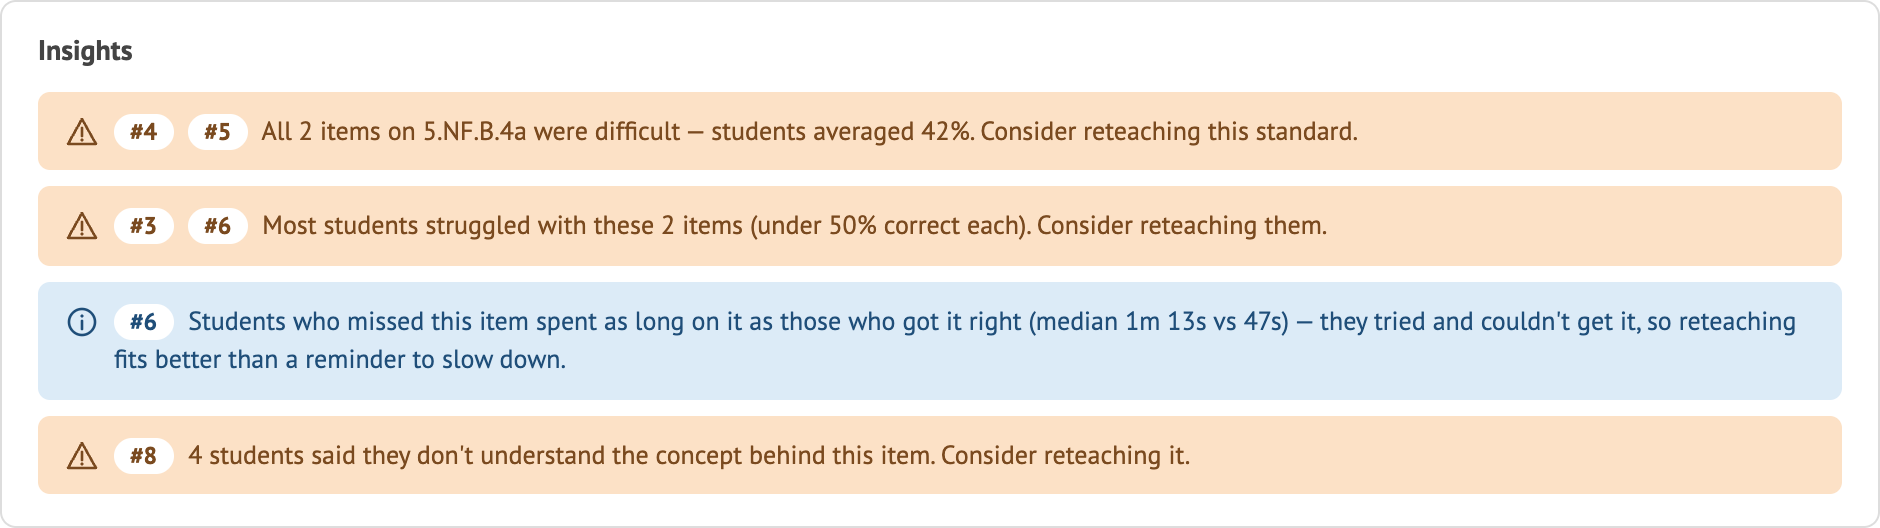
- Weak standard. Students averaged under 50% across a standard’s items.
- Widely missed items. Under 50% of students got the item right.
- They tried and couldn’t get it. Students who missed the item spent at least as long on it as students who got it right. Reteach it instead of telling them to slow down.
- “I don’t understand.” Three or more students said so in their reflection.
Misconceptions
A wrong answer many students share is often more useful than a score, because it shows how they’re thinking.
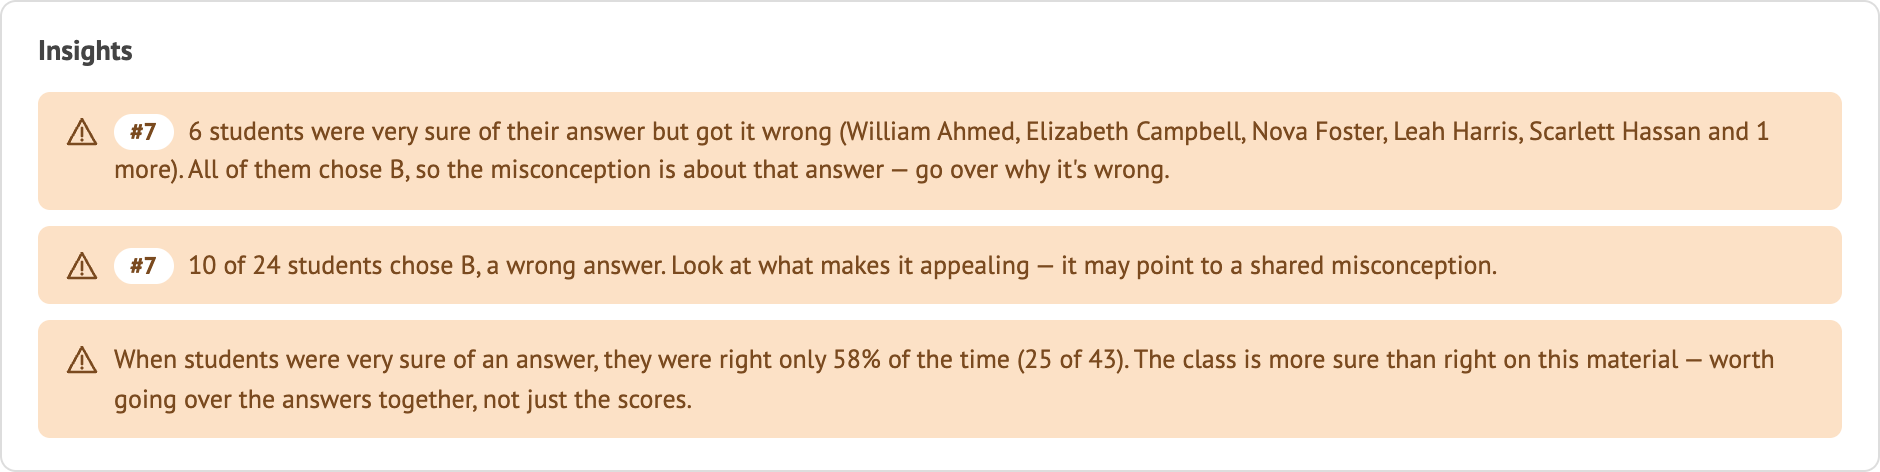
- Sure but wrong. Students rated themselves Very sure and still missed it. They probably learned it incorrectly, which takes more than a quick review to undo.
- Common wrong answer. At least 30% of students picked the same wrong choice.
- More sure than right. Across the test, how often Very sure answers were actually right. Below 70%, go over the answers together. At 90% or above, students know what they know, so follow up on their Guessing and Kind of sure answers.
How students spent their time
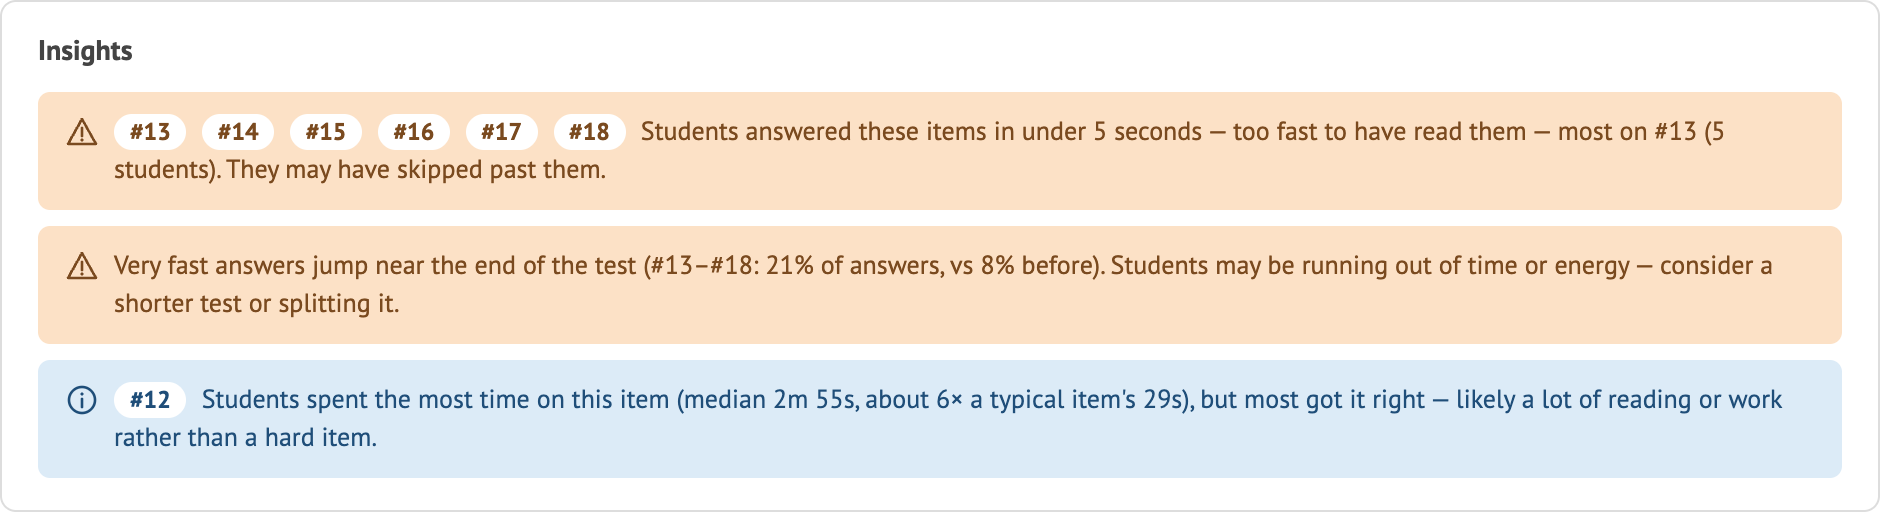
- Answered too fast. Students answered in under 5 seconds, too fast to have read the question.
- Fatigue at the end. Very fast answers jump in the last third of the test. Students may be running out of time or energy, so consider a shorter test or splitting it.
- Time sink. An item took at least a minute and about three times as long as a typical item. Naiku tells you whether it was hard or just a lot of reading or work.
What students told you
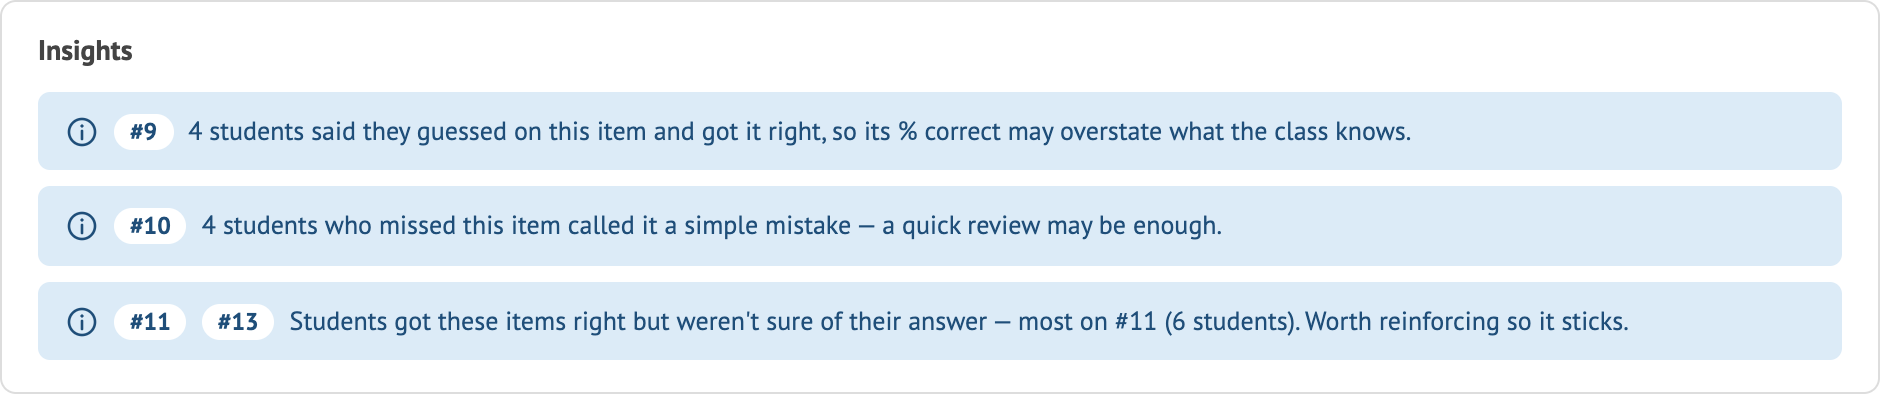
- Lucky guesses. Students guessed and got it right, so the percent correct may overstate what the class knows.
- Simple mistakes. Students who missed it say it was a slip. A quick review may be enough.
- Right but unsure. Students got it right but weren’t confident. Reinforce it so it sticks.
What students mastered

Standards averaging 90% or higher, and items at least 90% of students got right. You may be able to move on.
Read an item card
Below Insights, each question has its own card.
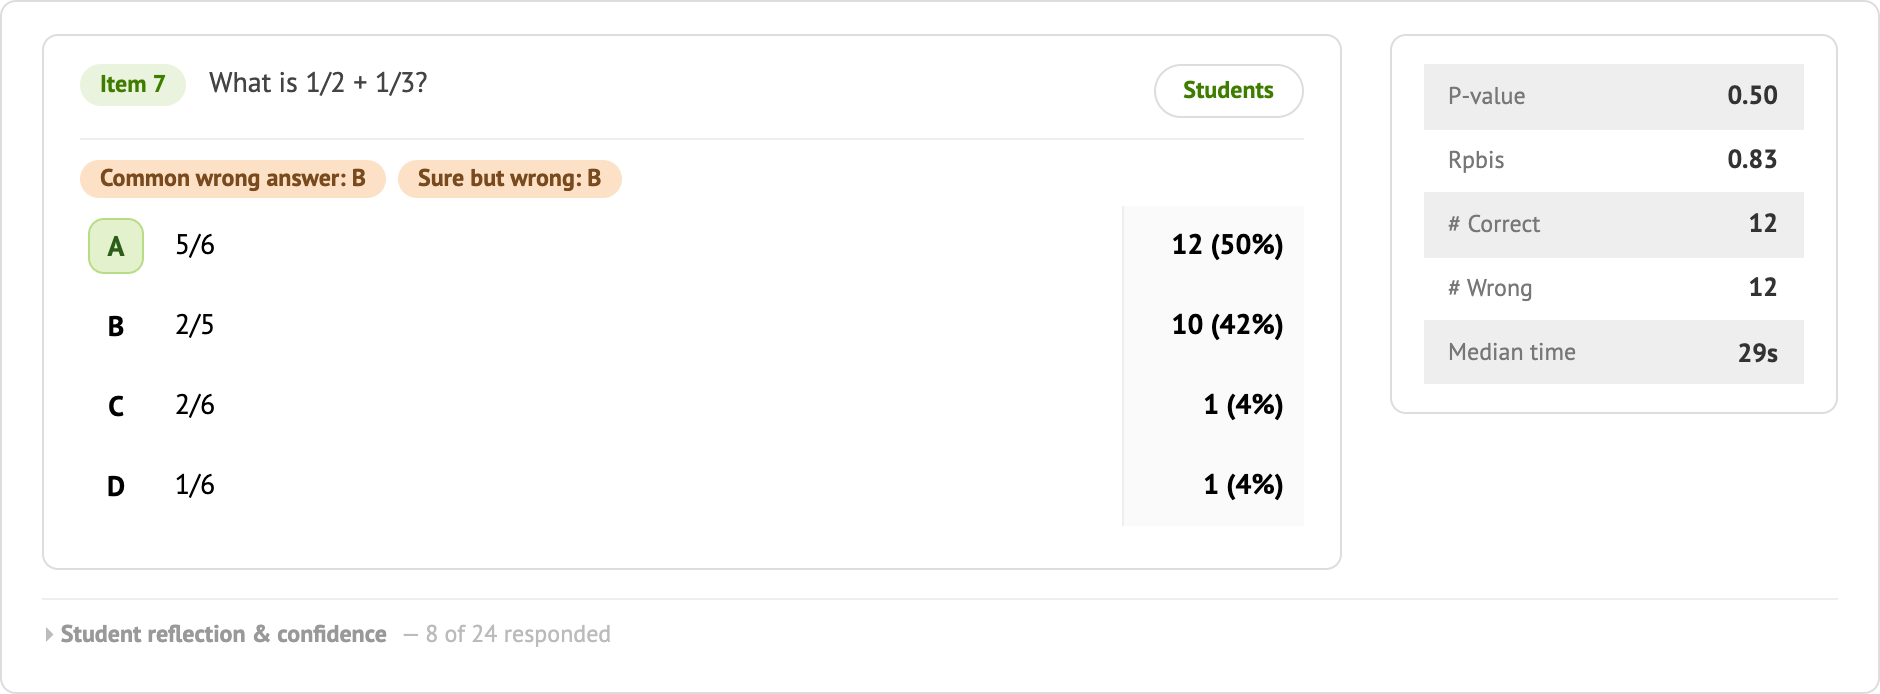
- Tags repeat the insights right on the card: Check item, Reteach, Common wrong answer, Sure but wrong and Answered too fast.
- Answer choices show how many students picked each one. The correct answer is highlighted.
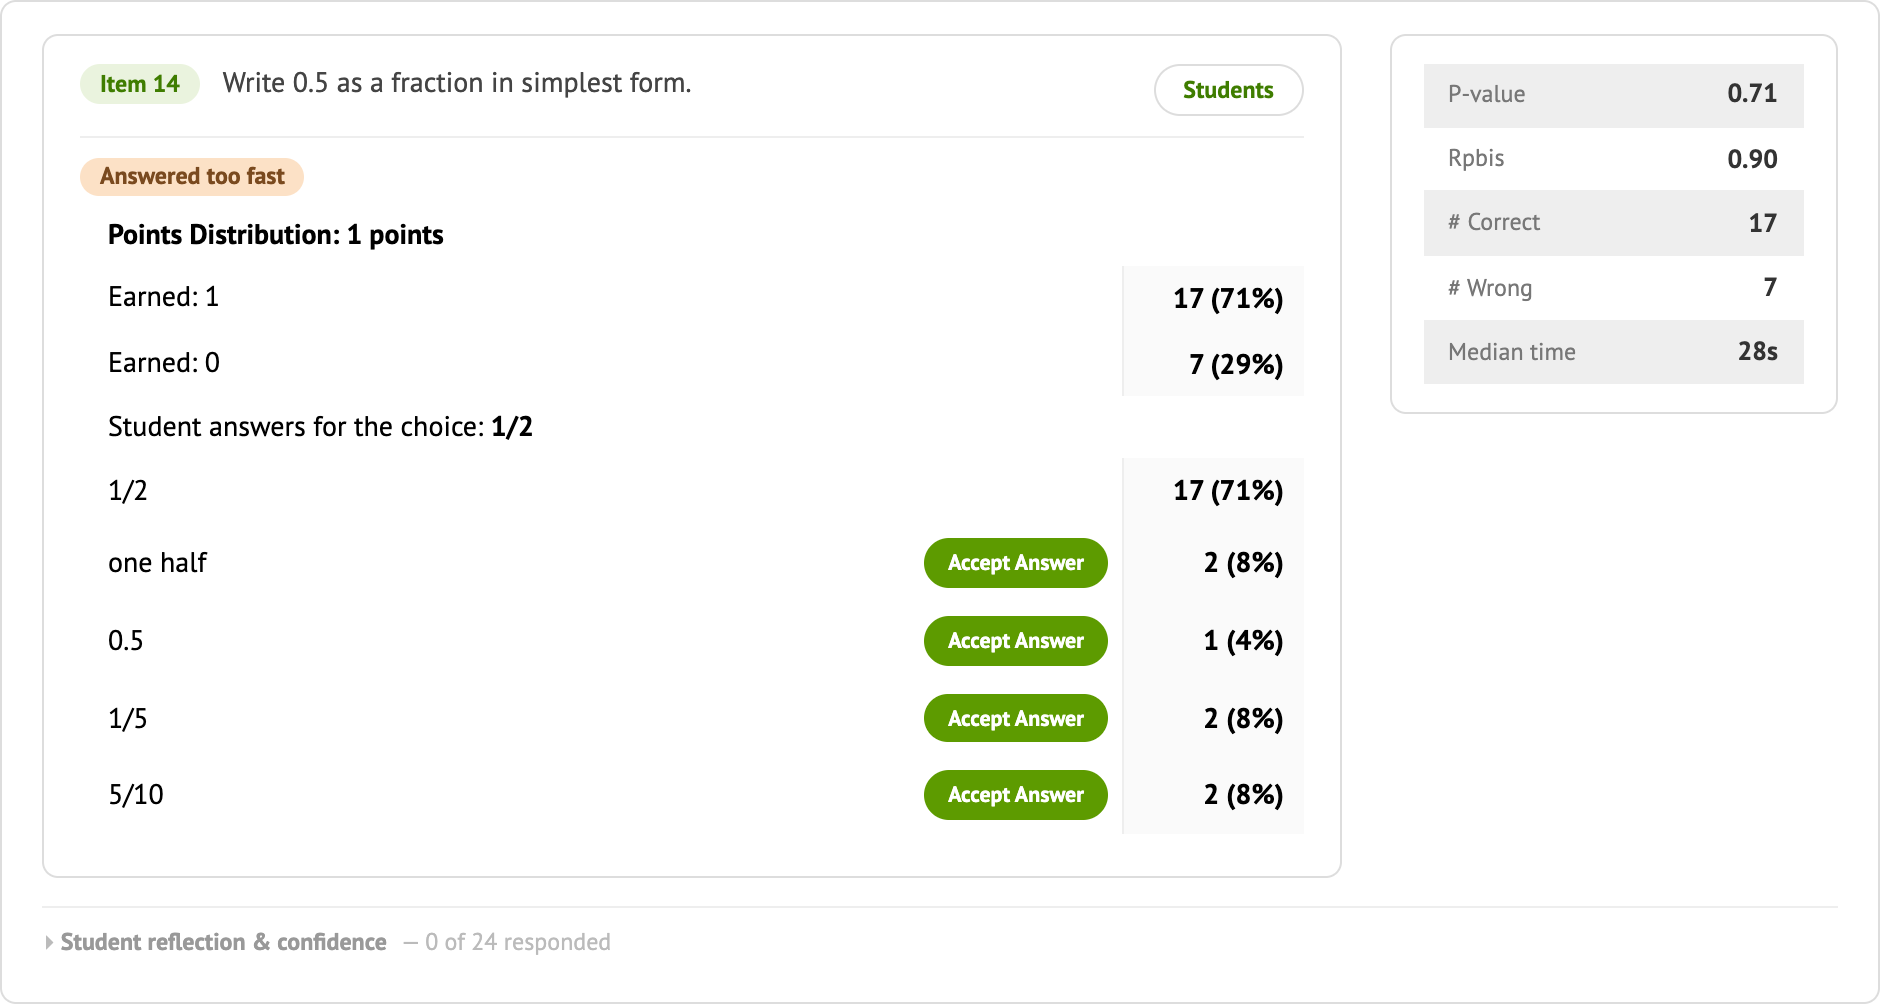
- The stats box shows P-value, Rpbis, # Correct, # Wrong and Median time, plus the item’s standards.
See who picked what
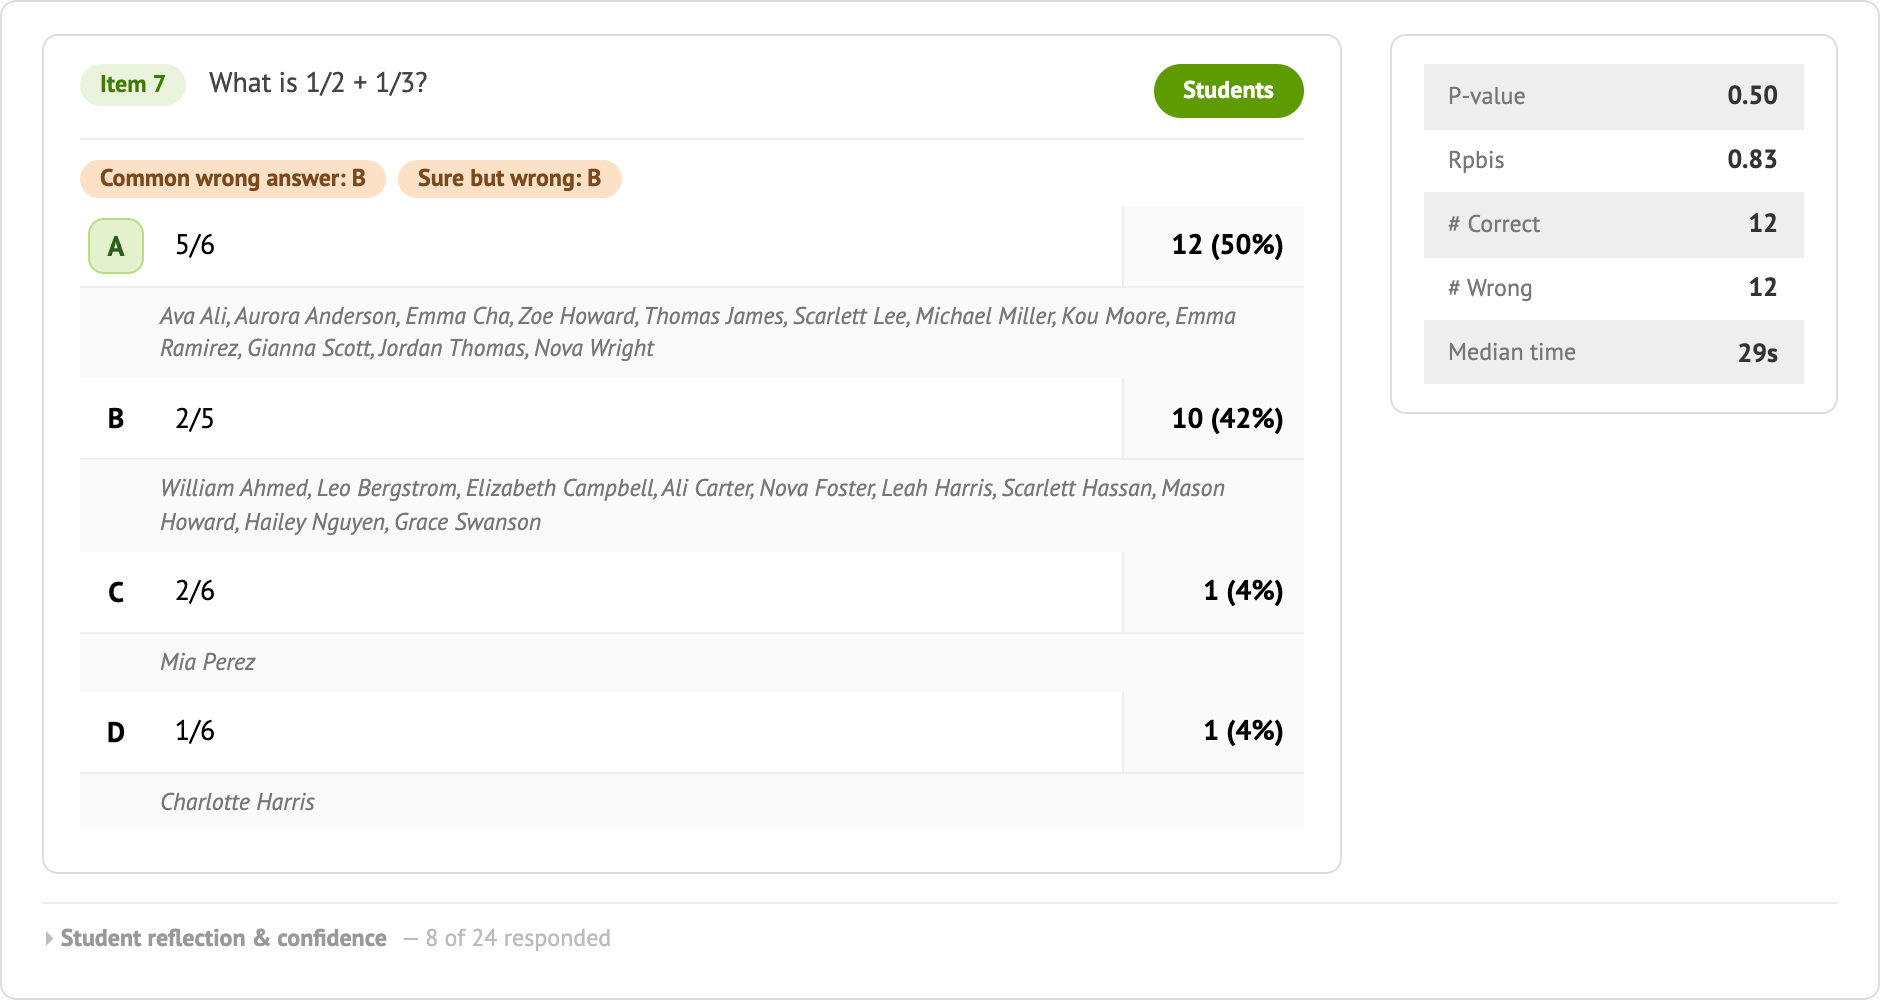
Click Students on a card to list the students behind each answer. This makes it easy to form a small group. Click Students at the top of the list to show names on every card.
Reflection and confidence
Open Student reflection & confidence at the bottom of a card to see how students rated their answers and how they reflected.

Fix a question
Wrong answer key. This card shows the warning sign: most students chose B, including the strongest ones, and the Rpbis is negative.
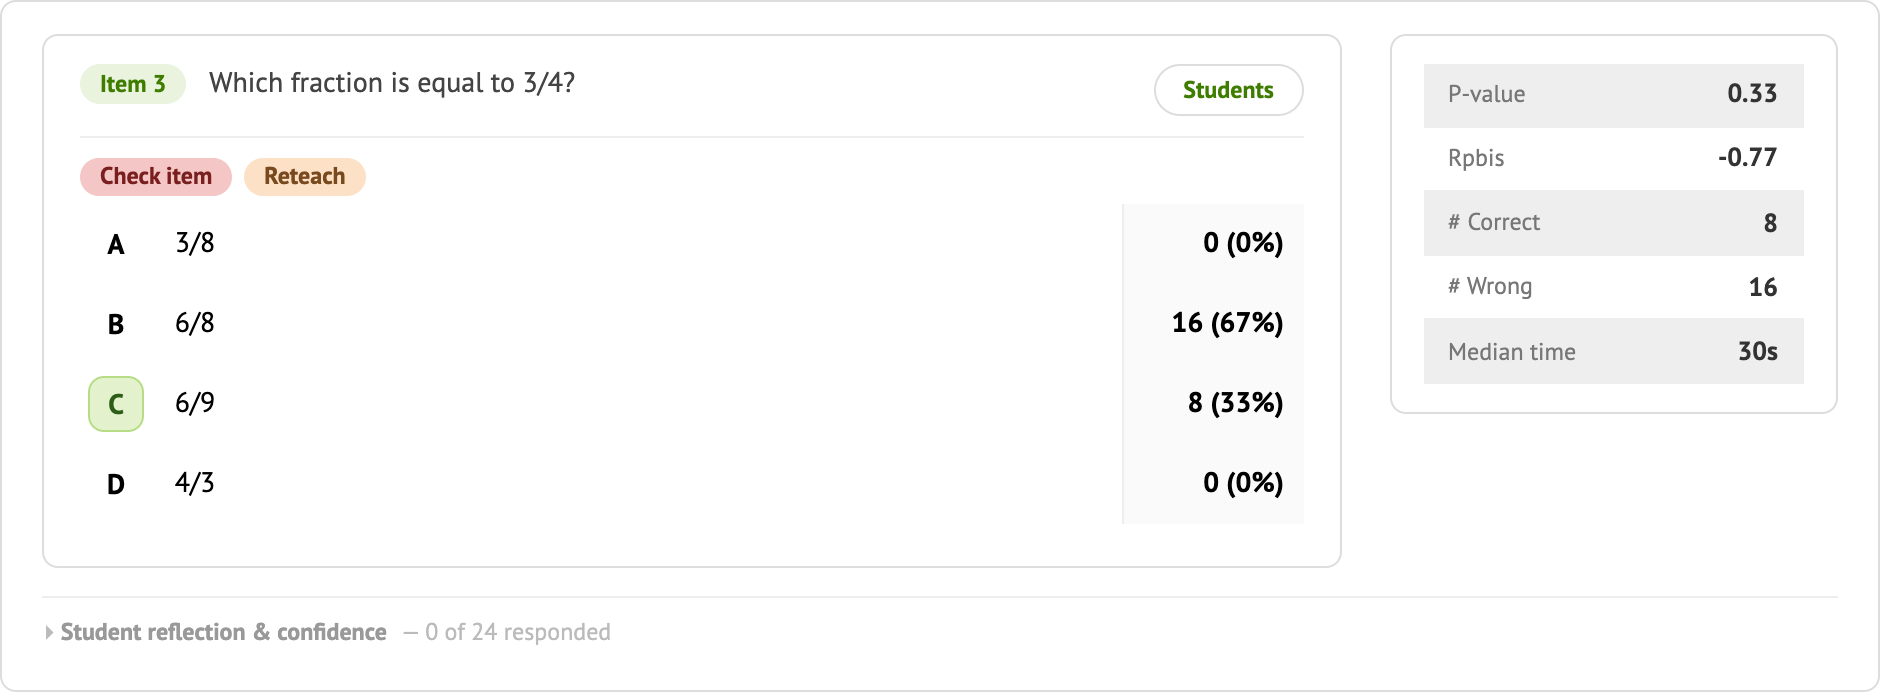
Click the item’s number on its card, choose Edit, mark the correct answer and save. Naiku recalculates students’ scores automatically. See Fix a Wrong Answer Key.
A typed answer that should count. On short-answer items, Naiku lists each answer students typed. Click Accept Answer next to one that should be correct, and Naiku rescores the students who gave it. If the test has results from earlier school years, Naiku asks whether to rescore those too.
What the statistics mean
Hover over a statistic in Naiku for a short definition.
| Statistic | What it tells you |
|---|---|
| P-value | The share of students who got the item right. 0.90 is easy, and below 0.50 is hard. |
| Rpbis | Whether students who did well on the whole test also got this item right. Higher is better. A negative value can mean a confusing question or a wrong key. |
| Median time | Half the students spent less than this, and half spent more. It appears when at least 10 answers were timed. |
Combine classes and export
- Combine with: in the report header, choose your other classes that took the same test. The whole report, including Insights, recalculates for everyone you select.
- Export: choose Actions ▼ → Export Item Analysis to CSV.