
Class Dashboard
On this page
Class Results covers one test. The Class Dashboard covers your whole class over time: every test in a date range, every standard those tests covered, and how your students did last year.
Open it
Click Classes, then Class Dashboard on the class’s card. You can also open a class and click View Class Dashboard.
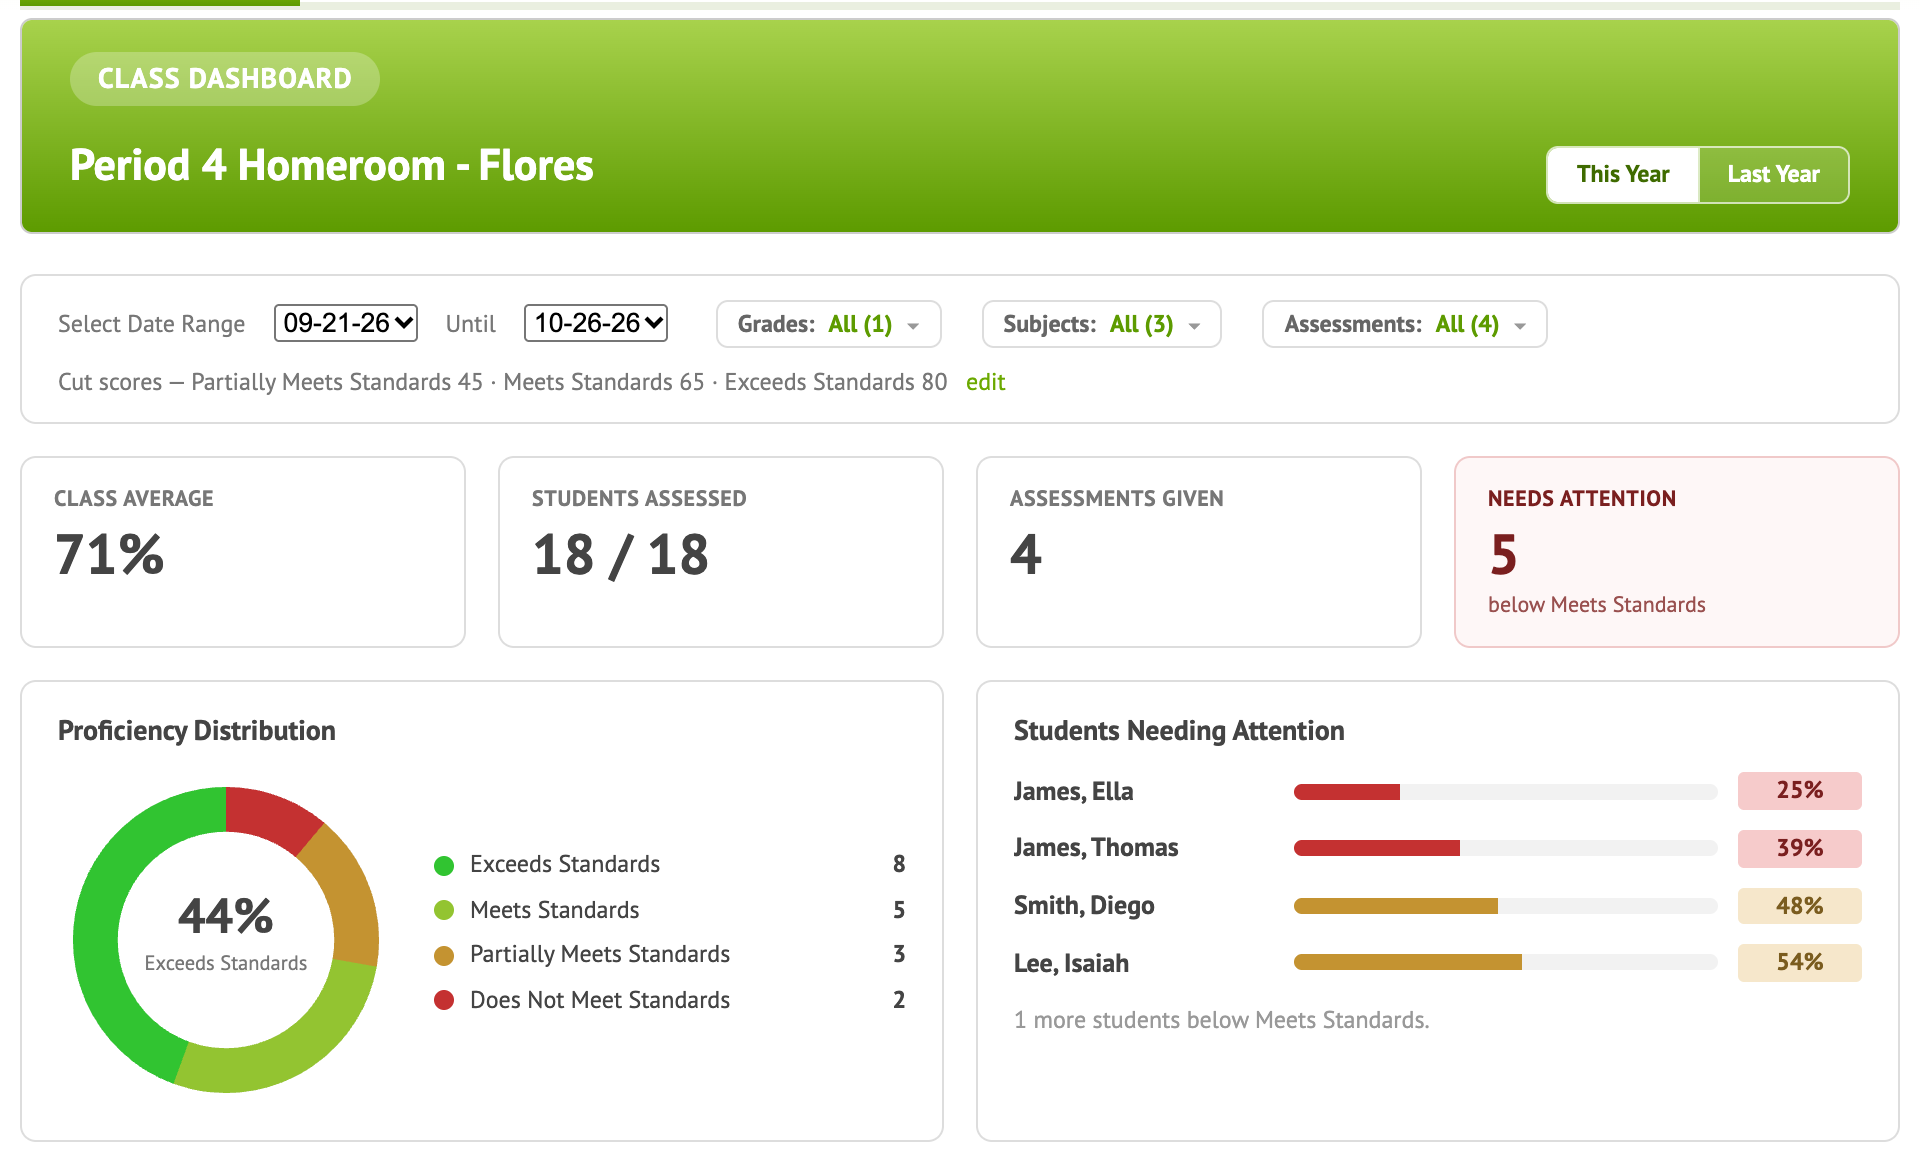
Use Select Date Range in the header to change the period. You can also filter by grade, subject, or specific assessments. Switch between This Year and Last Year at the top right.
This Year’s insight
The dashboard shows the single most important thing to look at right now, so you get one clear signal.

Naiku checks for these, in this order, and shows the first one that applies:
| Insight | When you’ll see it | What to do |
|---|---|---|
| A score of 0% | A student has a 0% | Confirm the test was actually taken |
| Below proficiency | Half or more of the class is below your lowest cut score | Plan whole-class reteaching |
| Weakest standard | One standard is 65 or more points below the strongest | Focus your next lesson there |
| Students well below average | Five or more students are 15+ points below the class average | Pull a small group |
| Already advanced | 90% or more of the class is at your top level | Offer extension work |
Who needs attention
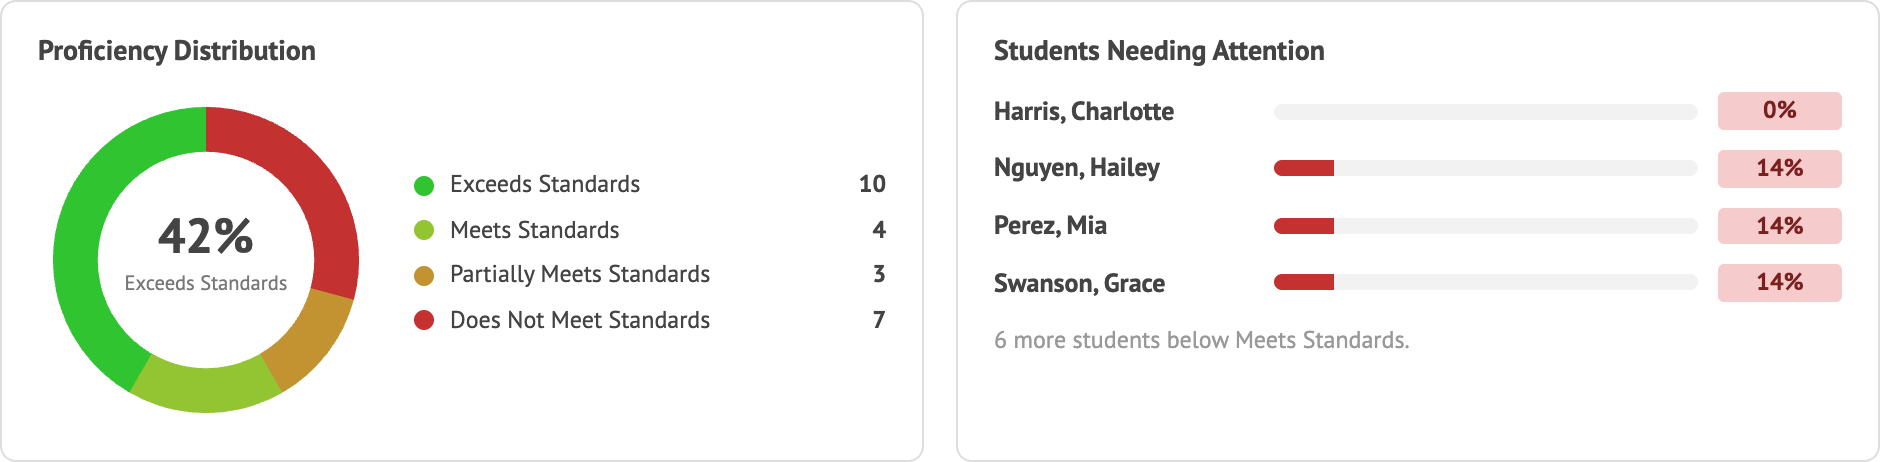
Proficiency Distribution shows how students split across your levels. Students Needing Attention lists who’s below your proficiency cut score across the tests in this period. The Class Roster below ranks every student, with a dashed line at the cut score.
Track growth with Assessment Breakdown
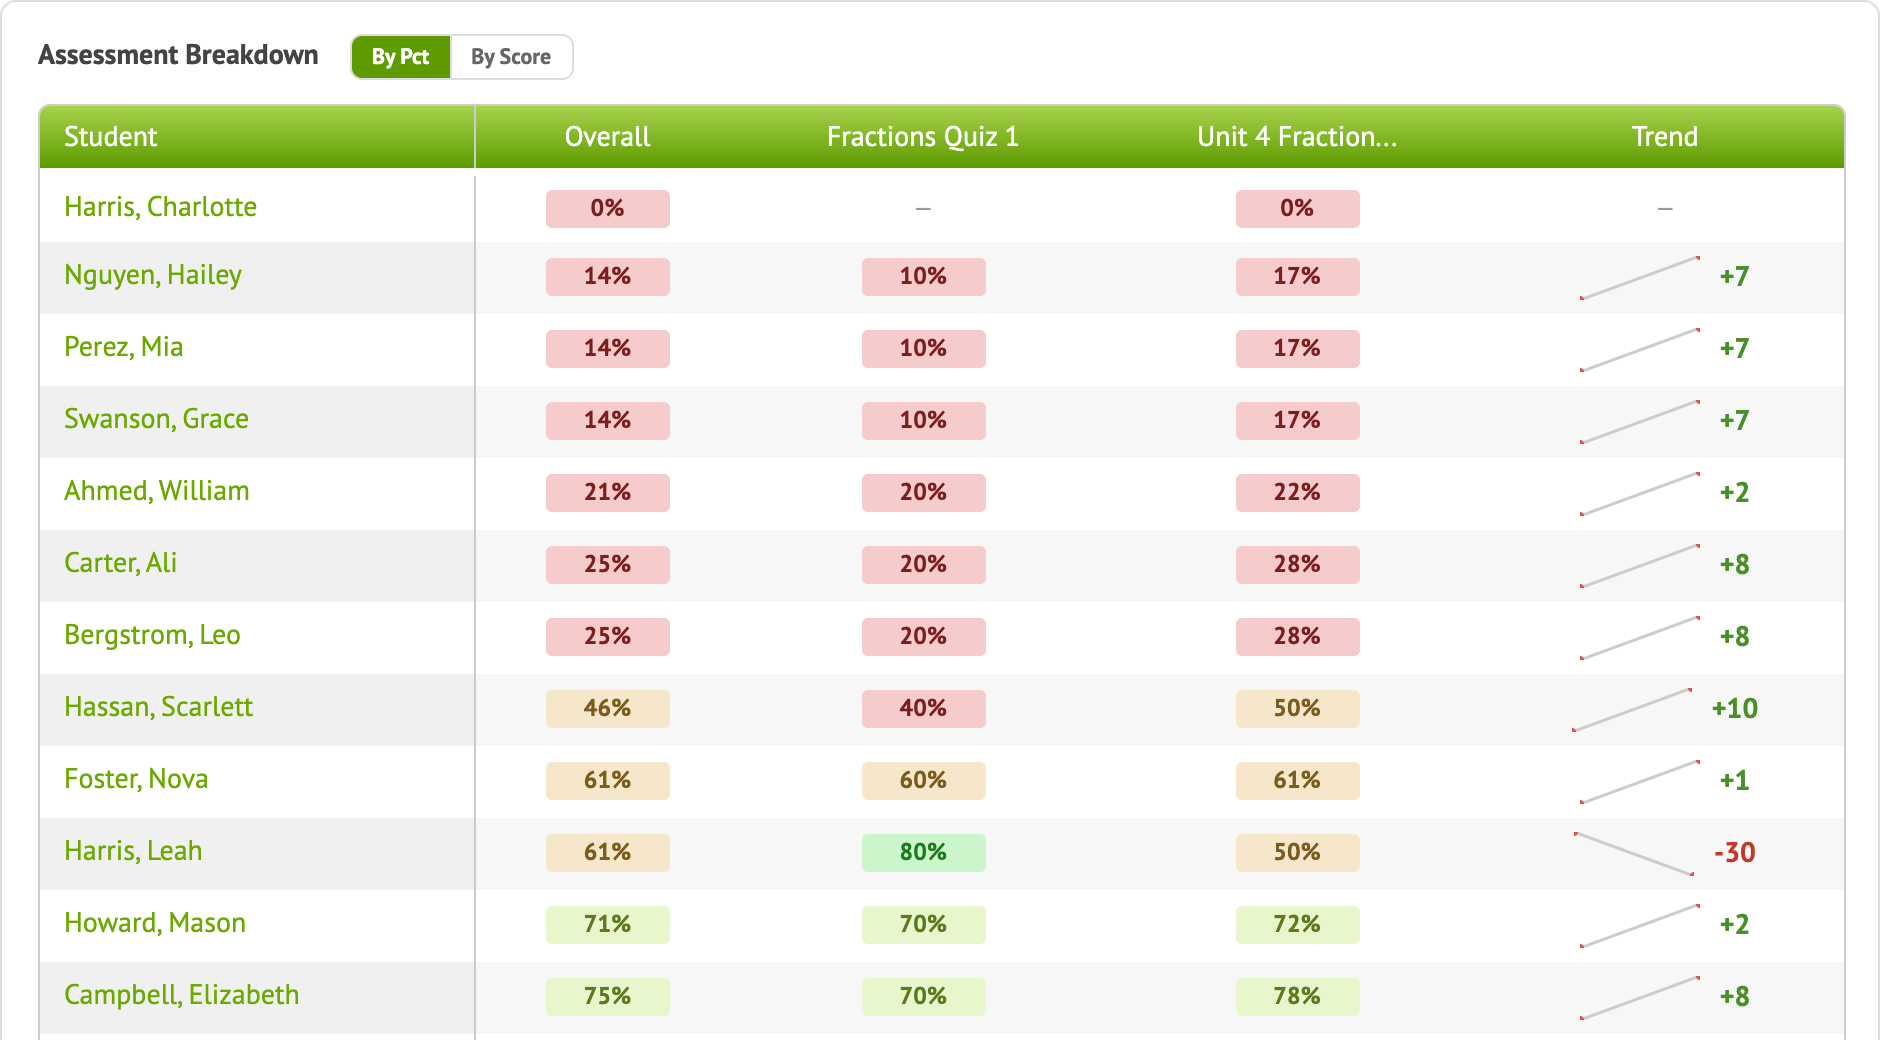
See every test in the period, with each student’s score. The Trend column shows their recent scores as a small line and their change since the previous test, so a sudden drop like the −30 here stands out.
Plan reteaching with the Standards Heatmap
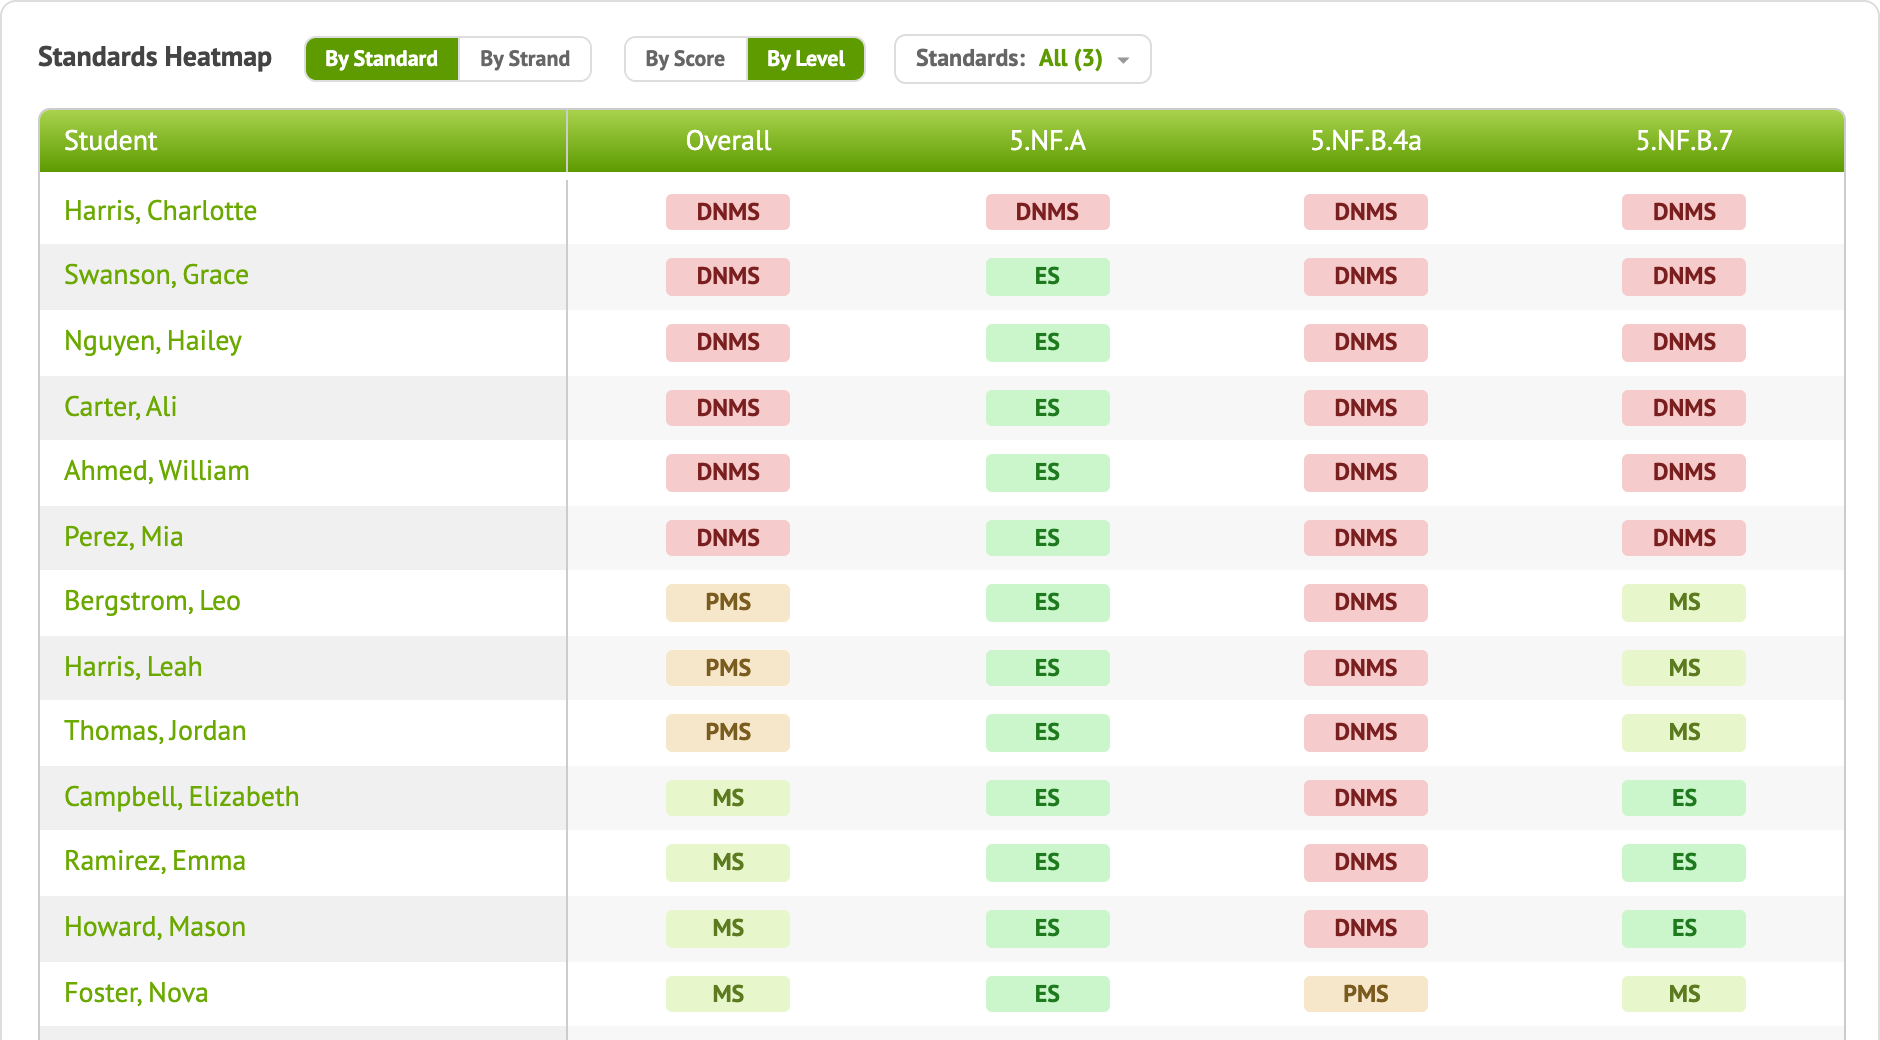
Each row is a student and each column is a standard, color-coded by proficiency.
- A column of red is a standard to reteach to the whole class.
- A row of red is a student who needs extra help.
- A few red cells in a column are a ready-made small group.
Switch between By Standard and By Strand, and between By Score and By Level. Click a column header to sort by it.
Last Year: know your students before you teach
Click Last Year to see how the students now in your class did on each standard last school year, wherever they were tested in your district. It’s especially useful at the start of the year or when you get a new student.
Unlike This Year, What stands out shows every insight that applies:
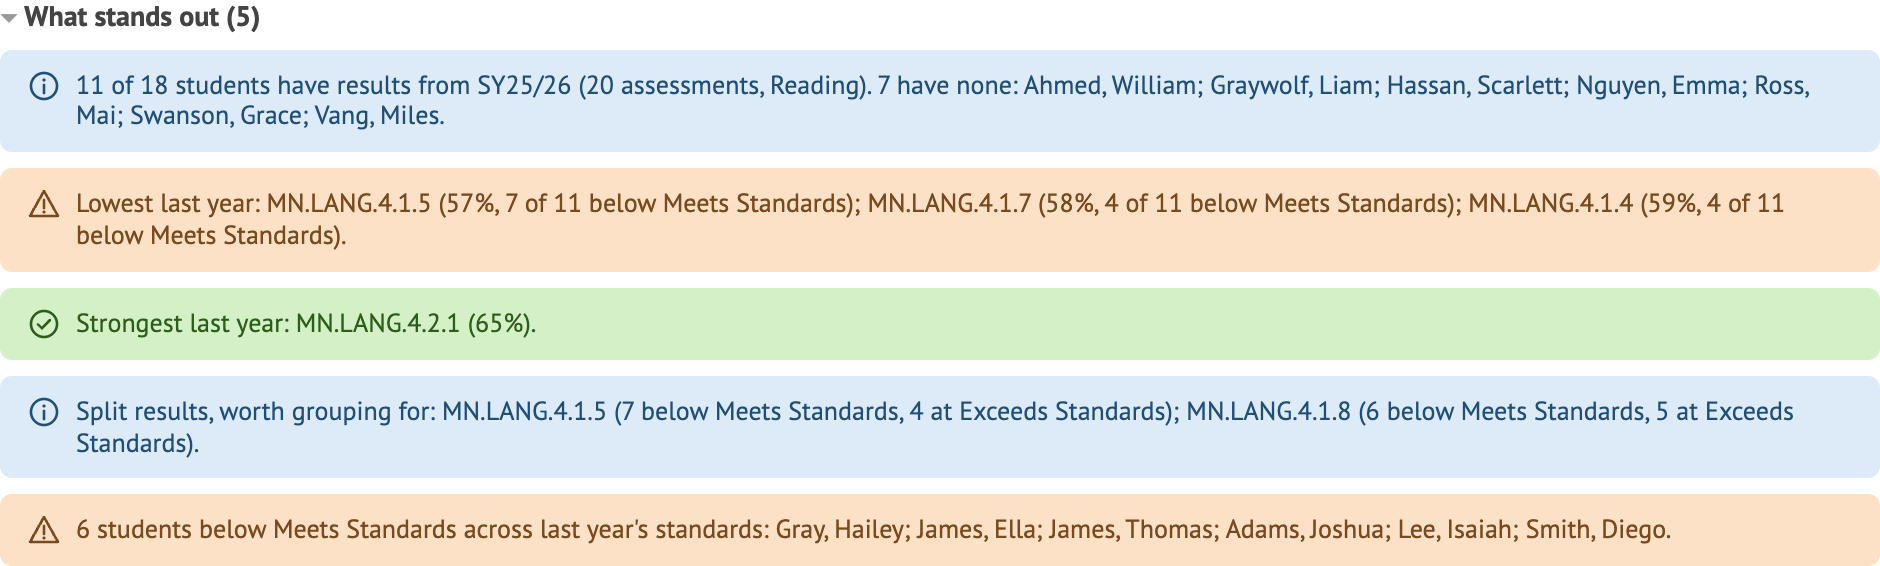
- Coverage. How many students have results from last year, and who doesn’t.
- Lowest last year. The standards to review first.
- Strongest last year. Standards you may be able to move through faster.
- Split results. Standards where at least a quarter of students were below proficient and at least a quarter were at the top level. Group students rather than teaching one lesson.
- Students to watch. Students who were below proficient across last year’s standards.
- Thin evidence. Standards with too few students to trust are left out of these lists, and Naiku tells you how many.
Choose a different Subject if your students have results in more than one.
Go deeper on one student
Click a student’s name for their own report, including how they’re doing by standard and over time. See Student Performance Reports.