
Resources · Case study
Eagle Ridge Academy turns Driven by Data into daily practice, and closes the gap
With Naiku, Eagle Ridge Academy built its data-driven instruction routines around Paul Bambrick-Santoyo’s Driven by Data 2.0. Over the last four school years, students who qualify for free or reduced-price lunch outperform the statewide average in math.
- 51%of ERA free/reduced lunch students proficient in math on the 2025 MCA, compared with 45% of all students statewide
- +13 ptsmath proficiency gain for free/reduced lunch students since SY21-22
- 14 → 4 ptsreading gap between free/reduced lunch students and the state average
The goal: data-driven instruction teachers can actually keep up with
Eagle Ridge Academy’s leaders adopted the approach in Driven by Data 2.0: give regular interim assessments, analyze the results closely, act on them right away and build a school culture around that cycle. The framework works, but it asks a lot of teachers. Analysis has to be fast and specific enough for teachers to act on it while the content is still fresh.
Eagle Ridge needed an assessment platform that could match those routines instead of adding more work to them.
What Eagle Ridge did with Naiku
Reports built around the framework
Naiku worked with Eagle Ridge’s academic team to develop customized reports aligned with the strategies in Driven by Data 2.0. Teachers see results by standard and by question as soon as students finish, so their data meetings start with analysis instead of number-crunching.
One of those reports, Item Scores, was built at Eagle Ridge’s request. It puts the item-level analysis at the heart of Driven by Data on one screen: every student, every question and every standard. A blank cell means the student answered correctly. A letter shows the wrong answer they chose, so patterns jump out. If half the class picked the same distractor, that points to a shared misconception, not a careless mistake. The bottom row gives the class average for each question, and answers students marked “very sure” but got wrong are highlighted for follow-up.
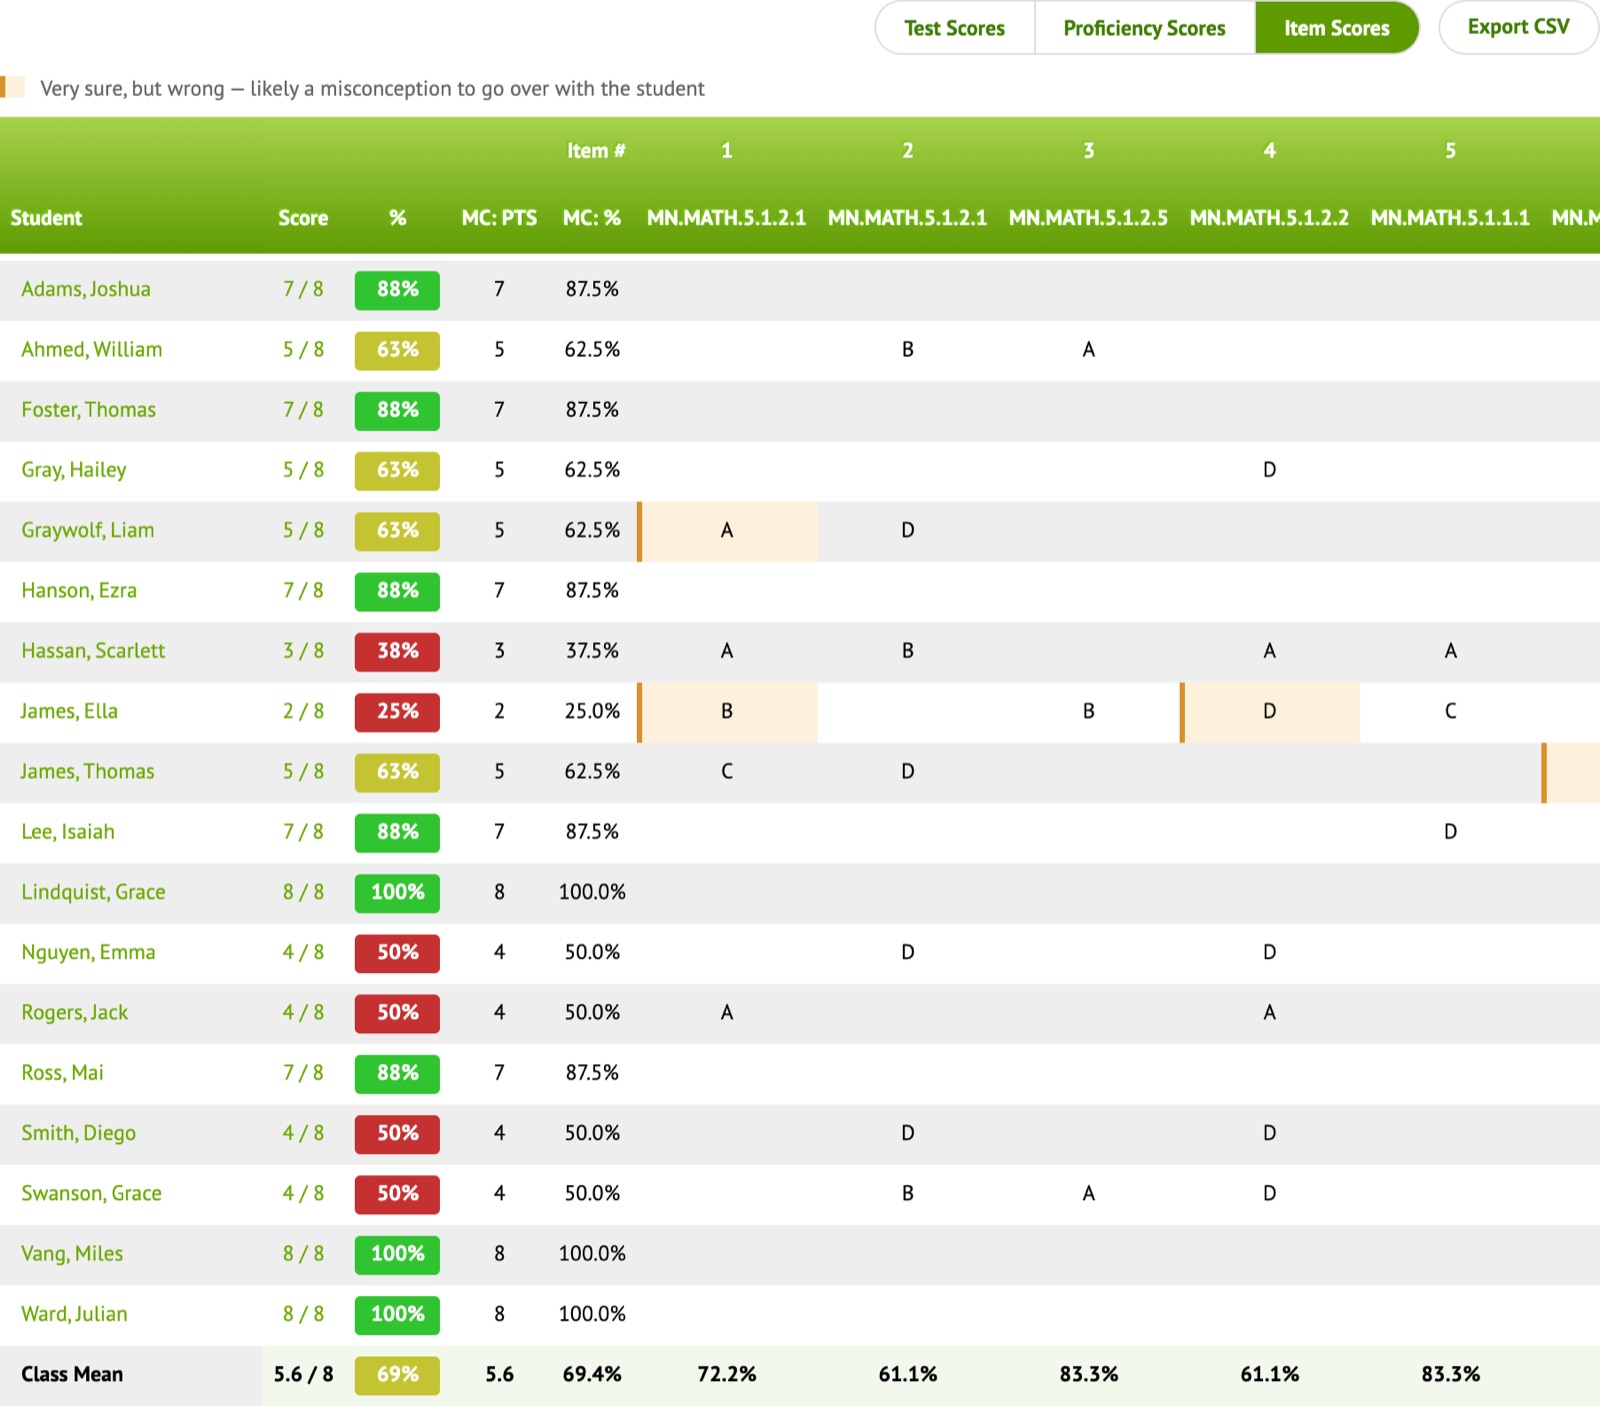
Since then, Item Scores has become part of Naiku for every school.
Interim assessment data in every student’s profile
Naiku also partnered with Eagle Ridge’s data warehouse to bring interim assessment results into each student’s profile. Assessment insights sit alongside the rest of a student’s record, giving staff a full view of each student’s academic journey. That lets the Academy take a whole-child approach when it responds to student needs.
Rosters that stay current
Classes and students sync to Naiku automatically through OneRoster, so teachers spend no time on setup and every result lands with the right student.
“In collaboration with Naiku, Eagle Ridge Academy has been enhancing data-driven instructional practices, leading to impressive gains in student learning. Thanks to Naiku’s responsiveness in developing customized reports aligned with the strategies outlined in Driven by Data 2.0 by Paul Bambrick-Santoyo, educators have been able to implement these methods more efficiently and effectively.
The results speak for themselves: Free and Reduced Lunch students at ERA are outperforming statewide averages in math and are making significant progress in closing the gap in reading.”

The results
Eagle Ridge tracks proficiency on the Minnesota Comprehensive Assessments for all of its students and for students who qualify for free or reduced-price lunch, and compares both with all students statewide.
In math, proficiency among free/reduced lunch students rose from 38% in SY21-22 to 51% in SY24-25. They passed the statewide average for all students (45%), which held flat over the same period.
In reading, the same students went from 14 points below the statewide average to 4 points below it (45% compared with 49%).
- ERA all students
- State, all students
- ERA free/reduced lunch
Show data table
| Year | ERA all students | State, all students | ERA free/reduced lunch |
|---|---|---|---|
| SY21-22 | 70% | 45% | 38% |
| SY22-23 | 72% | 45% | 42% |
| SY23-24 | 69% | 45% | 42% |
| SY24-25 | 74% | 45% | 51% |
- ERA all students
- State, all students
- ERA free/reduced lunch
Show data table
| Year | ERA all students | State, all students | ERA free/reduced lunch |
|---|---|---|---|
| SY21-22 | 74% | 52% | 38% |
| SY22-23 | 72% | 50% | 48% |
| SY23-24 | 65% | 50% | 41% |
| SY24-25 | 69% | 49% | 45% |
Percent of students proficient on the Minnesota Comprehensive Assessments (MCA), all grades. Eagle Ridge Academy (ERA) students overall and those eligible for free or reduced-price lunch, compared with all students statewide. Source: Eagle Ridge Academy.
How Naiku supports each part of Driven by Data
Driven by Data 2.0 rests on four building blocks. Here is where Naiku fits in each one.
Assessment
Interim assessments aligned to the standards, given on a regular cycle.
In NaikuStandards-aligned interim assessments built in Naiku, scored automatically the moment students submit.
Analysis
Teachers dig into item-level and standard-level results to find out why students missed what they missed.
In NaikuClass Results and Item Analysis show results by standard and by question, including the wrong answers students chose, and write the main takeaways in plain language.
Action
Analysis turns into reteaching plans, small groups and follow-up.
In NaikuInsights name the students to group, the standards to reteach and the misconceptions to address, so teachers can plan the next lesson right away.
Culture
Leaders and teacher teams build routines around the data.
In NaikuTeacher teams share assessments and results, and Common Assessment reports let leaders compare classrooms on the same interim test.
Want to go deeper? Read our white paper, Data-Driven Instruction with Naiku.
Bring data-driven instruction to your school.
See the reports Eagle Ridge’s teachers use, set up for your standards and your assessments.